| Corcoran Technical Trading Patterns For July 21 |
| By Clive Corcoran |
Published
07/21/2008
|
Stocks
|
Unrated
|
|
|
|
Corcoran Technical Trading Patterns For July 21
Reviewing charts this weekend shows that many asset classes are at key levels and one suspects that this coming week could clarify some of the market's intentions regarding the numerous economic and financial cross currents.
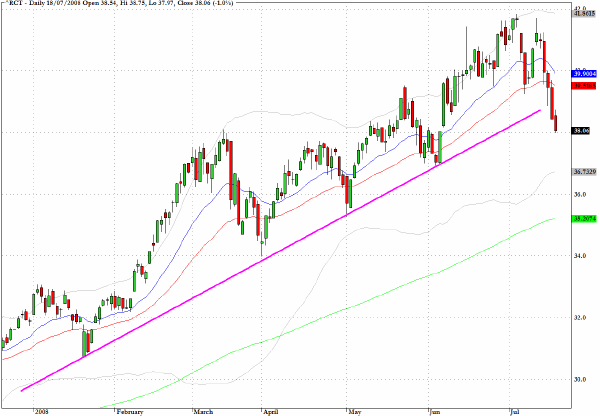
One of the most pertinent charts is for commodities in general, as represented by the Jim Rogers Commodity Index (^RCT). Friday's close put us just below the trend-line through lows since the turn of the year and also below the 20 and 50-day EMA. If the hard asset enthusiasts are not ready to throw in the towel we are now at levels where one would expect to see some broad buying support for certain commodities. On specifics the Amex Natural Gas Index (^XNG) achieved the 625 level discussed here more than a week ago in Friday's trading.
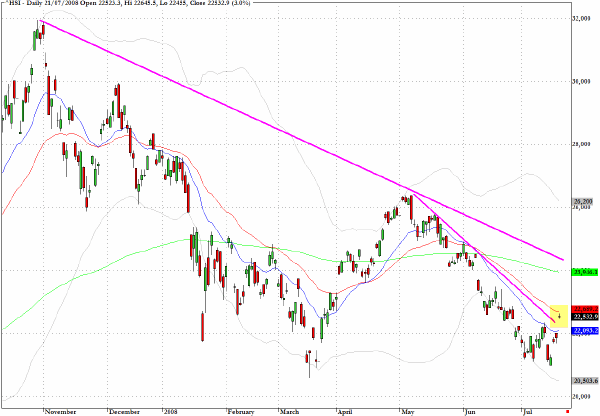
Asian trading on Monday morning brought divergent performances from two barometer indices. The Nikkei 225 failed to make progress despite the positive tone to the latter part of last week in the US, whereas the Hang Seng (^HSI) managed to move ahead by 3%.
The doji star closing pattern on the Hong Kong index chart shows a violation of the recent downward trend-line which also tracks the 20-day moving average. Taking a longer term perspective it would seem that the longer lasting trendline which coincides closely with the 200-day EMA at around 24000 will provide a major hurdle as we approach the Beijing Olympics.
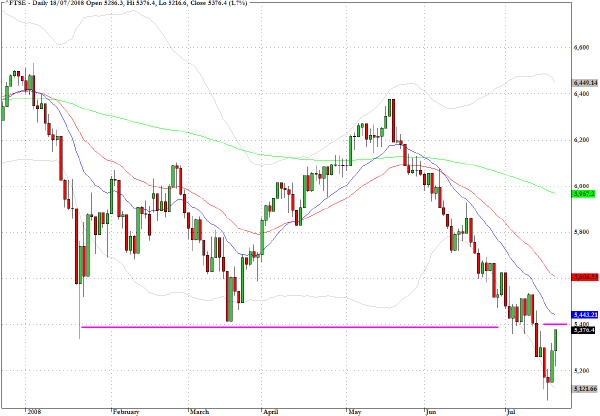
The FTSE 100 could find that the support level near 5400 which was violated on July 11; selloff may now pose a challenge to further recovery in the near term.
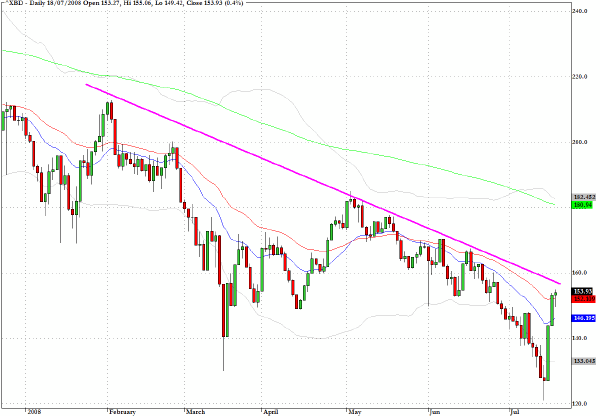
The broker/dealer sector has snapped back strongly as short covering gathers momentum amongst the financials. As suggested here recently the fundamentals for the investment bankers are changing with fewer opportunities for "cutting edge" financial technology and I would expect a re-evaluation of upside potential from some investors that have grown accustomed to lucrative margins for all of the big players in the sector.
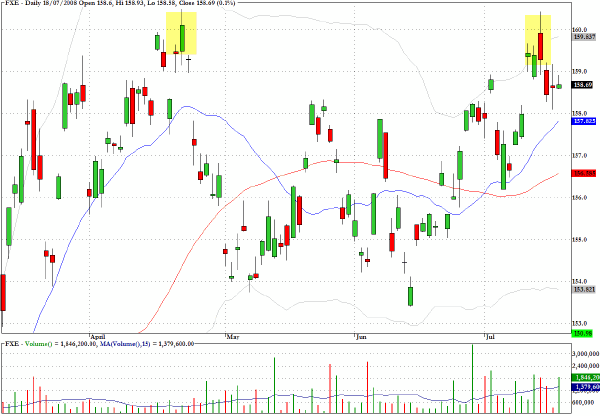
The Euro/USD cross rate is another market which is sitting at a key level. Reviewing the chart below there is a case to be made that last week's shooting star formation at the $1.60 could represent a double top failure pattern. The retreat from the most recent attempt to hurdle the $1.60 has been subdued unlike the drop that followed the attempt back in April. If the euro remains above $1.58 in the near term, in European trading Monday it remains above $1.59, I would suggest that odds favor another effort to seek out higher levels.
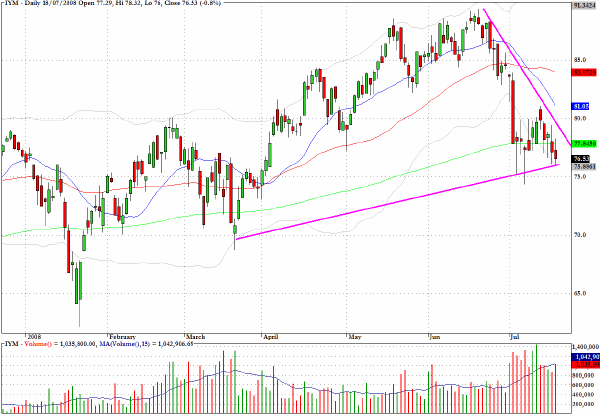
The industrial materials sector is experiencing congestion at the 200-day EMA and the rather pronounced triangular pattern suggests that a directional breakout is imminent.
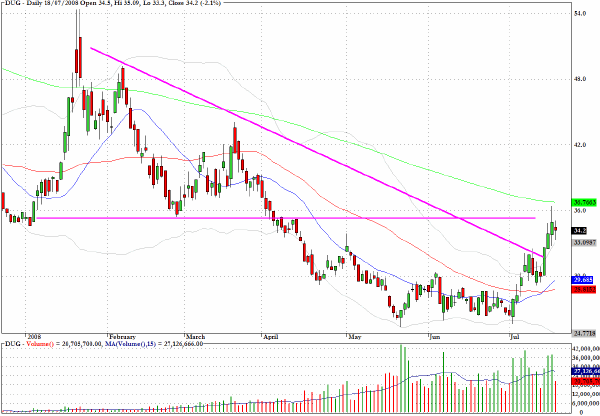
The long position in the Ultra Short Oil and Gas sector fund, DUG, has proven to be very profitable but the exit target which was set near to the 200-day EMA was met in last Thursday's session. The clear break out from the downtrend may turn out, at least in the near term, to have been a trap for those seeking large positional bets on a decline in the energy complex (this is an inverse fund) but there is a definite technical hurdle to overcome at $36 on this chart.
One of the advantages of this sector fund is that it amalgamates prices across two key commodities and allows one to have a view of energy prices rather than separate view of oil and natural gas.
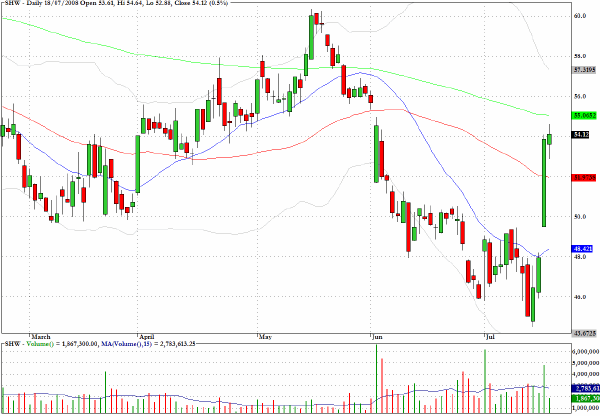
In comments on July 10, I noted that Sherwin Williams (SHW) along with most stocks had been experiencing substantial whipsaws but that the positive technical pattern was still intact. Late last week the stock surged and would have rewarded more than 12% since recommended.
Clive Corcoran is the publisher of TradeWithForm.com, which provides daily analysis and commentary on the US stock market. He specializes in market neutral investing and and is currently working on a book about the benefits of trading with long/short strategies, which is scheduled for publication later this year.
Disclaimer
The purpose of this article is to offer you the chance to review the trading methodology, risk reduction strategies and portfolio construction techniques described at tradewithform.com. There is no guarantee that the trading strategies advocated will be profitable. Moreover, there is a risk that following these strategies will lead to loss of capital. Past results are no guarantee of future results. Trading stocks and CFD's can yield large rewards, but also has large potential risks. Trading with leverage can be especially risky. You should be fully aware of the risks of trading in the capital markets. You are strongly advised not to trade with capital.
|