| Corcoran Technical Trading Patterns For July 22 |
| By Clive Corcoran |
Published
07/22/2008
|
Stocks
|
Unrated
|
|
|
|
Corcoran Technical Trading Patterns For July 22
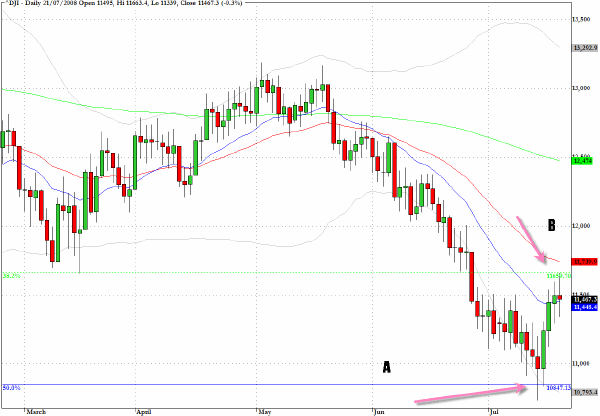
The Dow Jones Industrials (^DJI) is currently in a zone between the 50% and the 38% retracement of the March 2003-October 2007 low. Last week the index sank below the 10800 level intraday (A) and, as it now appears, this may have marked an important intermediate term low. In yesterday's trading the index found resistance at the 11650 level (B) which not only marks the 38% retracement level but also the region of the mid-March lows as well.
Overall breadth is improving although the degree of short covering in certain sectors of the market, resulting in some spectacular gains over the last week, may be partially obscuring the fact that there has been a shift to more positive overall dynamics for equities.
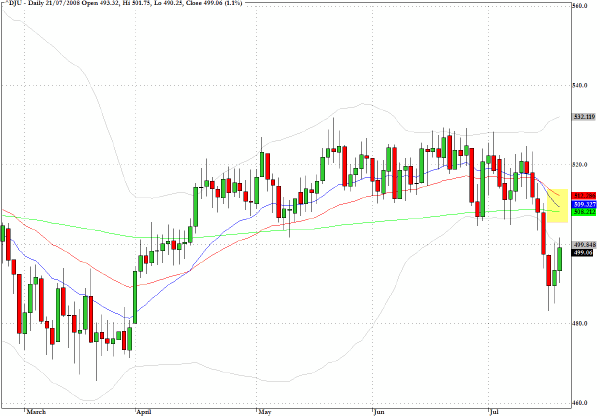
The Dow Jones Utilities (^DJU) looks to be one of the least technically favorable sectors of the market at present. A bear flag is emerging on the daily chart and there will be stiff overhead resistance from the intersection of all three moving averages in the region of 510.
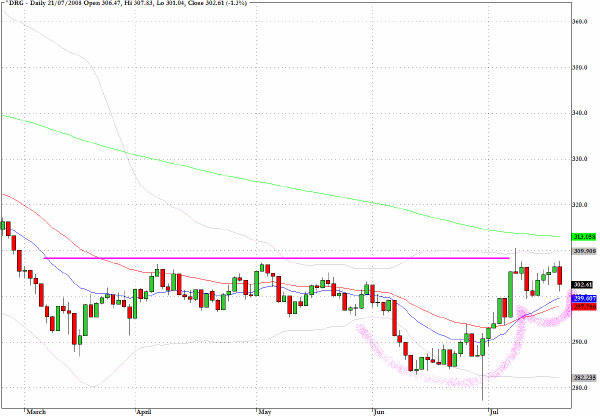
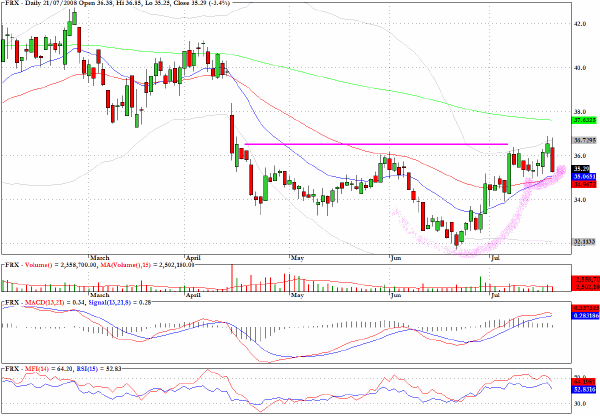
The Amex Pharmaceutical Index (^DRG) has a constructive cup and handle pattern and if the index can break above the horizontal resistance line at 310 marked on the chart, which also more or less coincides with the 200-day EMA, this sector could see much higher prices ahead.
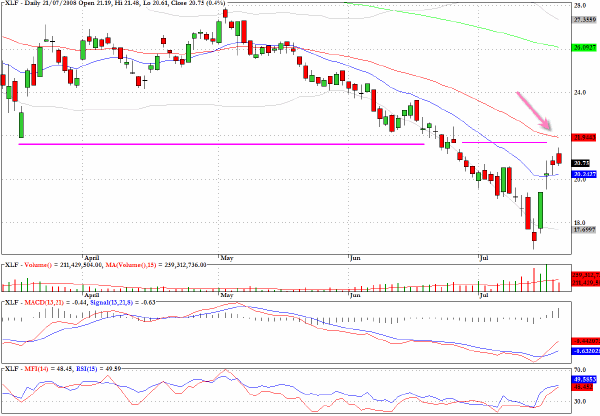
The exchange traded fund for the regional banks has been one of the main beneficiaries of the febrile short covering in the financial sector. The fund has gained more than 25% in the last week but has now entered a chart area where those who have been squeezing the shorts may decide to pause and consolidate.
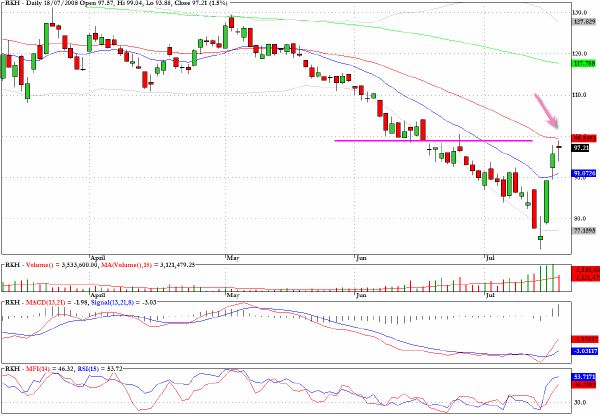
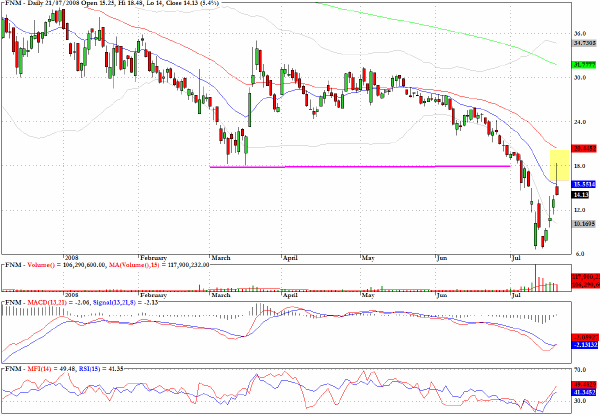
One of the most extraordinary charts is for Fannie Mae (FNM) which yesterday registered a shooting star after hitting resistance in the vicinity of the mid March low. This stock has doubled in the last week but the rather counter intuitive nature of the maths belies the fact that this stock is still trading at only 20% of its all time highest close.
I prefer to admire the chart rather than stake any trading capital in trying to guess which way this goes next.
XLF has gained 20% in the last week but the short covering may now take a pause at an area of upside resistance.
One of the better looking charts on the long side is for Forest Labs (FRX) where the pattern echoes the formation seen on the Pharmaceutical index.
Clive Corcoran is the publisher of TradeWithForm.com, which provides daily analysis and commentary on the US stock market. He specializes in market neutral investing and and is currently working on a book about the benefits of trading with long/short strategies, which is scheduled for publication later this year.
Disclaimer
The purpose of this article is to offer you the chance to review the trading methodology, risk reduction strategies and portfolio construction techniques described at tradewithform.com. There is no guarantee that the trading strategies advocated will be profitable. Moreover, there is a risk that following these strategies will lead to loss of capital. Past results are no guarantee of future results. Trading stocks and CFD's can yield large rewards, but also has large potential risks. Trading with leverage can be especially risky. You should be fully aware of the risks of trading in the capital markets. You are strongly advised not to trade with capital.
|