| Corcoran Technical Trading Patterns For July 23 |
| By Clive Corcoran |
Published
07/23/2008
|
Stocks
|
Unrated
|
|
|
|
Corcoran Technical Trading Patterns For July 23
Asset re-allocation decisions are inspiring tectonic shifts in the inter-market strategies being followed by the large hedge funds and trading desks. Equities, and specifically financials are becoming the recipients of capital flows that are fleeing a whole range of commodities, and the forex market yesterday tipped us off to a significant re-thinking of dollar direction.
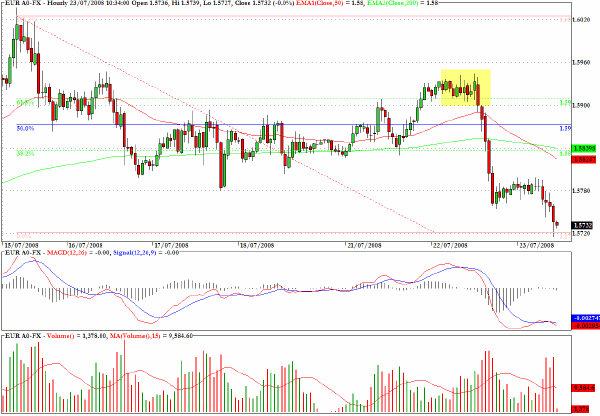
The hourly chart for the Euro/USD shows how during midday trading in New York yesterday selling hit the Euro at the 1.5930 level and this led to a quick drop down to the 1.5780 area. The decline has extended into European trading this morning.
If the Euro loses its grip at the 1.5840 level on any rebound, this could send us down to the bottom of the longer term trading range between 1.55 and 1.56. The implication here is that further downside in the Euro would suggest that the rally in equities and the exodus from the energy sector and other commodities could have further to run.
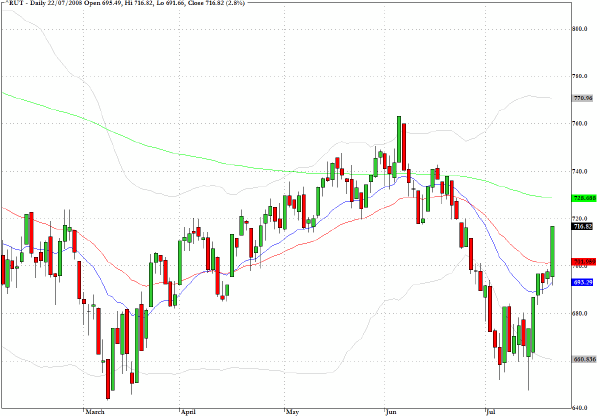
The Russell 2000 (^RUT) outpaced the rest of the market yesterday with a 2.8% gain. Price action over the last two weeks has validated the early warning hypothesis advanced here that when the index bounced at the 660 level this was a precursor to a turning of the tide for larger cap stocks as well. The extent of the recovery in the financials has been more dramatic than many were expecting (including me) and serves to highlight just how much of a doomsday scenario was being discounted earlier in July.
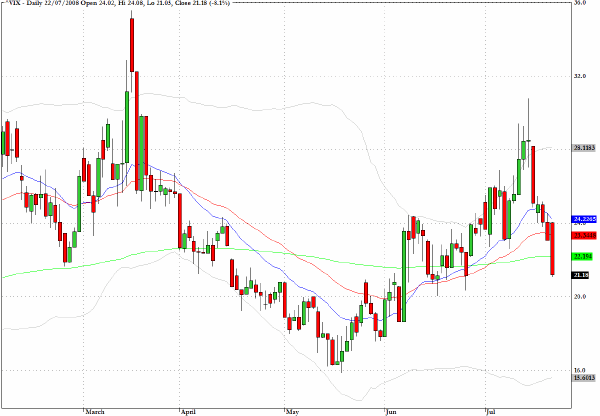
Large drops in the CBOE Volatility Index (VIX), including yesterday's drop below the 200-day EMA, underlines the remarkable dissipation of fear that has taken place in the last week.
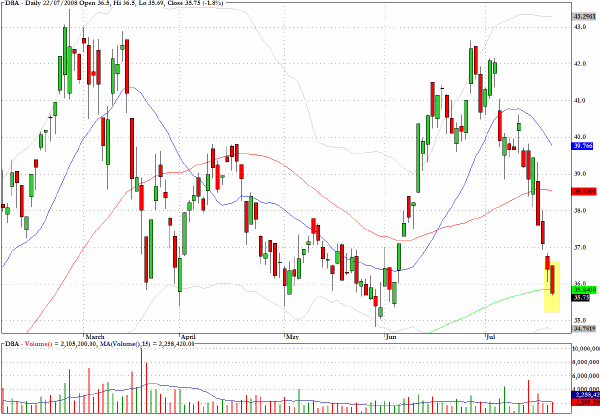
DBA, an exchange traded fund which tracks agricultural commodities, has seen a precipitous descent but is reaching an area where some support may arise at the 200-day EMA.
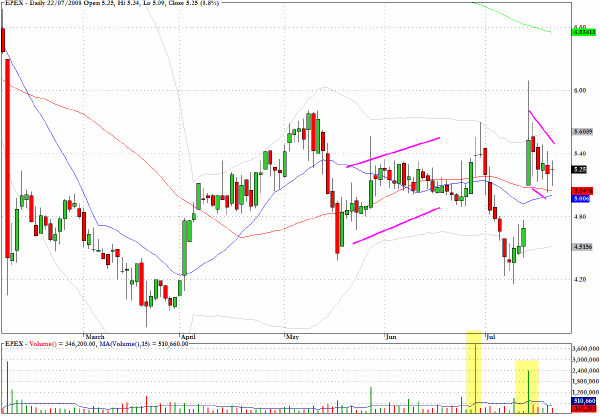
The chart for Edge Petroleum (EPEX) reveals a bullish flag pattern in the making, but the failure in early July after the extended rising channel that preceded it suggests that any upward progress may be short-lived.
Clive Corcoran is the publisher of TradeWithForm.com, which provides daily analysis and commentary on the US stock market. He specializes in market neutral investing and and is currently working on a book about the benefits of trading with long/short strategies, which is scheduled for publication later this year.
Disclaimer
The purpose of this article is to offer you the chance to review the trading methodology, risk reduction strategies and portfolio construction techniques described at tradewithform.com. There is no guarantee that the trading strategies advocated will be profitable. Moreover, there is a risk that following these strategies will lead to loss of capital. Past results are no guarantee of future results. Trading stocks and CFD's can yield large rewards, but also has large potential risks. Trading with leverage can be especially risky. You should be fully aware of the risks of trading in the capital markets. You are strongly advised not to trade with capital.
|