| What's The Chart For AT&T (T) Saying? |
| By Andy Swan |
Published
07/24/2008
|
Stocks
|
Unrated
|
|
|
|
What's The Chart For AT&T (T) Saying?
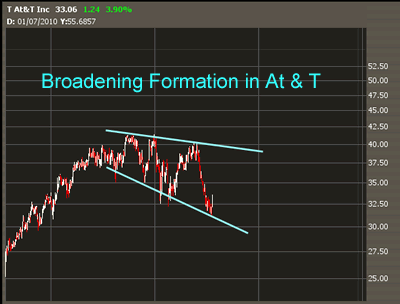
AT&T Inc (T) reported earning which were up 30% from Q2 2007; then T was downgraded by JP Morgan. What is T's chart saying?
T has been trading in a broadening formation over the last two years. Over the last month, T has stabilized at broadening support and looks to be setting up to make an upside move. This broadening formation indicates T could rally toward 39 over the coming months, regardless of being downgraded by JP Morgan. However, if I were going long I would put my stop just under 30 in the event of a sell-off.

Andy Swan is co-founder and head trader for DaytradeTeam.com. To get all of Andy's day trading, swing trading, and options trading alerts in real time, subscribe to a one-week, all-inclusive trial membership to DaytradeTeam by clicking here.
|