| The McMillan Options Strategist Weekly |
| By Lawrence G. McMillan |
Published
07/25/2008
|
Options
|
Unrated
|
|
|
|
The McMillan Options Strategist Weekly
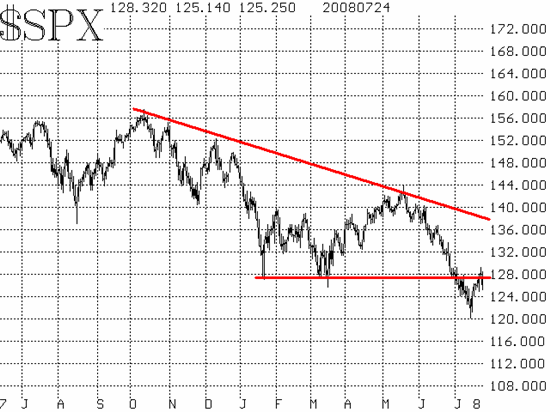
On July 15, the market reversed up from its lows and just kept on going for a 90-point $SPX rally, trough to peak. Is this the bottom? We can fairly safely say "No" to that inquiry, but it could be a strong oversold rally -- much as we saw last September, or in February or April of this year. What happens next, after this initial six-day oversold surge, will likely determine the next intermediate-term move in this market.
If this week's highs (1280, closing, or 1290 intraday) are exceeded, then a bullish pattern of higher highs and higher lows will have been established. A further rally attempt on the order of those earlier ones should ensue -- perhaps carrying roughly to 1320 or so. On the other hand, if the decline that started today continues right on down and violates the lows at 1200, then all bullish thoughts must be abandoned, as a new bearish leg will take hold, and a whole new bottoming process would have to begin at a lower level.
The $SPX chart is still negative, in that it is declining and so is its 20-day moving average. This week's oversold rally managed to poke above that 20-day moving average briefly -- a rather common occurrence -- but it couldn't hold there. If the bullish pattern of higher highs and higher lows does develop, we would expect -- as confirmation -- that the 20-day moving average will curl over and begin to rise.

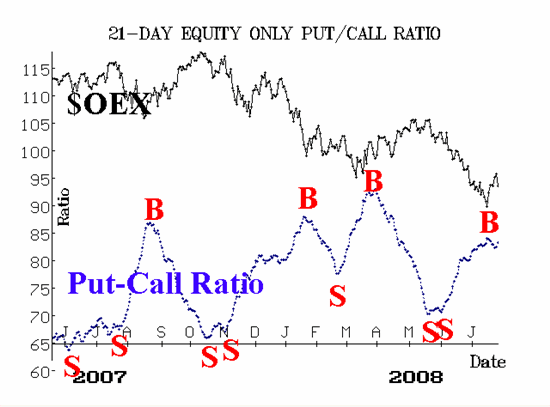
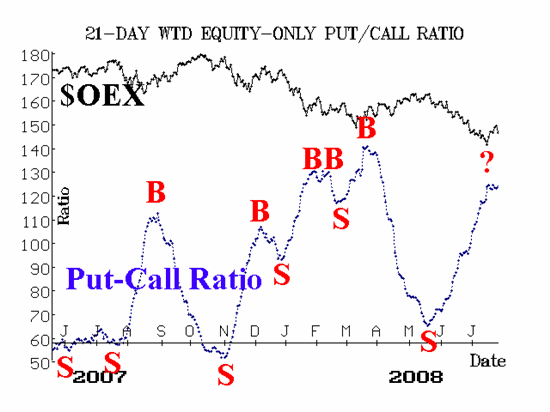
The equity-only put-call ratios are mixed. The standard ratio (Figure 1) officially rolled over to a buy signal recently, as confirmed by our computer analyses. However, the weighted ratio has not rolled over, again according to the same computer software.

Market breadth had gotten extremely oversold and thus was the main harbinger of the recent oversold rally. Now, that oversold condition has been alleviated. However, to really confirm a bullish condition, we would expect to see breadth expand to oversold readings quickly in a newly bullish phase. It didn't do that, so these buy signals have to be considered tepid at best.

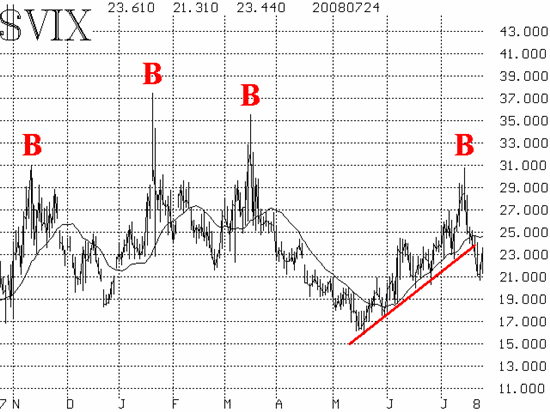
The volatility indices ($VIX and $VXO) gave strong buy signals by a) reversing downward from their July 15th peak, and b) violating the uptrend line that had been in place for $VIX since mid-May. As such, $VIX is now technically in a bullish downtrend, and will remain so unless it closes above 25.

From a longer-term perspective, we do not think the bear market is over. At best, a retest of the 1200 level will have to take place perhaps not for another couple of months. At worst, that retest will fail and the bear market will accelerate and continue. For now, though, there is a possibility of a further rally, which would be signaled by $SPX closing above 1280.
Lawrence G. McMillan is the author of two best selling books on options, including Options as a Strategic Investment, recognized as essential resources for any serious option trader's library.
|