| Corcoran Technical Trading Patterns For July 25 |
| By Clive Corcoran |
Published
07/25/2008
|
Stocks
|
Unrated
|
|
|
|
Corcoran Technical Trading Patterns For July 25
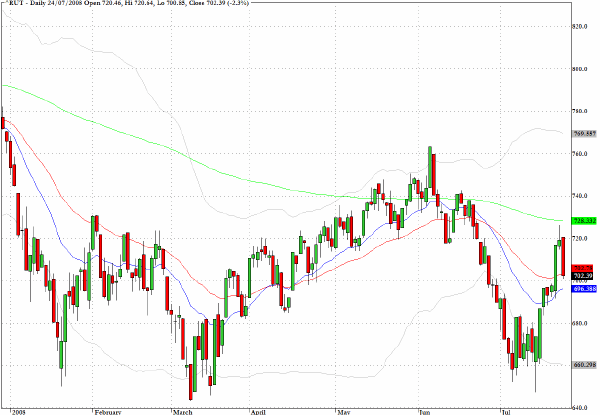
The shooting stars on many indices noted in yesterday's commentary near to chart resistance levels tipped us off to the overhead supply concerns mentioned. The Russell 2000 (^RUT) turned around almost exactly on cue and headed south in a broad based sell-off. There was no real pick up in volume on the downside and the technical damage to the recent rally seems fairly restricted.
To return to a topic that I have discussed several times, it is the relative out-performance of small cap indices since the October 2007 peak which distinguishes the bear market episode that we have seen evolving. What this suggests is that the larger caps which provide the greater liquidity, not only in the underlying constituent stocks, but also in the very actively traded derivatives and futures contracts, have been the preferred vehicle for the bearish camp to use. This highlights the major role now played by hedge funds using macro cross-asset strategies and in turn underlines that much of the downward price action has been via index linked short selling rather than the liquidation of holdings by long only funds.
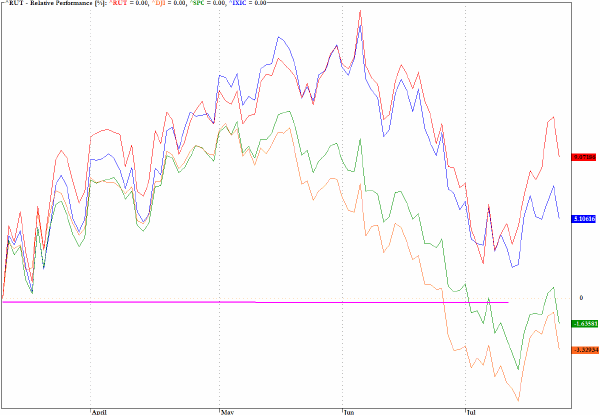
The relative performance chart below underlines the manner in which the larger cap indices were in the vanguard of the decline in early July. Taking March 10, 2008 as the base-line for the chart, the S&P 500 (^SPC) and the DJIA are still below those mid March levels whilst the Russell 2000 is nine percent ahead even following yesterday's close and the Nasdaq Composite Index (^IXIC) has managed a gain of 5%.
My contention is that if we are to see a second, perhaps more brutal leg to this bear market sell-off, it will be reflected in broad based liquidation of the portfolios of long only fund managers and that this will have to manifest itself in visible weakness in the Russell 2000 and Nasdaq Composite indices.
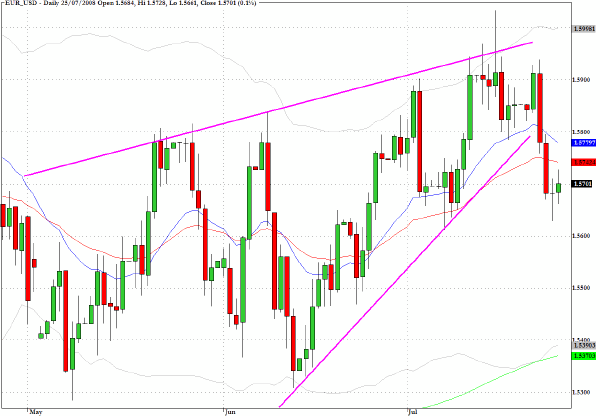
In European trading on Friday morning the Euro is staging something of a rebound against the dollar. The chart below however shows that a key trend-line has been violated during the course of this week.
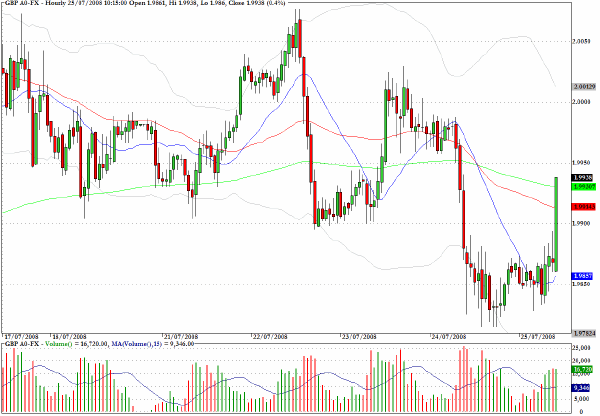
Sterling had a poor session on all the major crosses in Thursday's session but is staging a rather abrupt turnaround in Friday's session. As revealed in yesterday's chart there is a succession of lower highs visible on the hourly chart for the British pound and the region around $2.00 now could act as a serious obstacle.
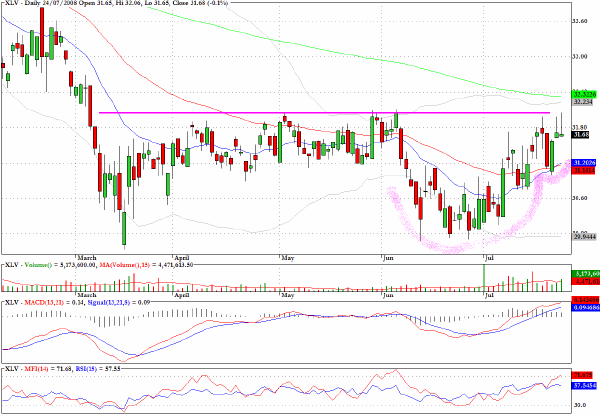
Earlier this week I noted the constructive chart pattern for the pharmaceuticals and similar chart formations are appearing in the health care sector. The sector fund, XLV, has an even more plausible case of the cup and handle pattern that can be a precursor to an upward breakout.
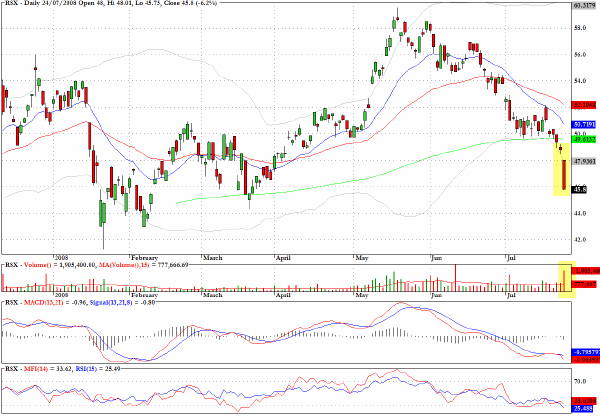
The sector fund for Russian equities (RSX) had been straddling the 200-day EMA for several sessions waiting for direction and it came in yesterday's session. This market which is largely reliant on commodity based corporations is beginning to lose its appeal to the large hedge fund community that had been quietly stacking up gains in this market.
In a related context the Canadian stock market as reflected in the sector fund, EWC, is also suffering disproportionately from weakness in the energy sector.
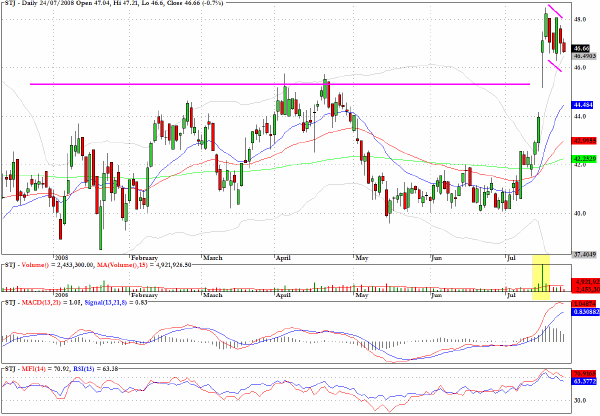
The chart for St Jude Medical (STJ) depicts what may be in store for the health care sector more generally. The gap up move was preceded by the similar cup with handle pattern and now the pullback pattern presents an attractive risk/reward proposition on the long side.
Clive Corcoran is the publisher of TradeWithForm.com, which provides daily analysis and commentary on the US stock market. He specializes in market neutral investing and and is currently working on a book about the benefits of trading with long/short strategies, which is scheduled for publication later this year.
Disclaimer
The purpose of this article is to offer you the chance to review the trading methodology, risk reduction strategies and portfolio construction techniques described at tradewithform.com. There is no guarantee that the trading strategies advocated will be profitable. Moreover, there is a risk that following these strategies will lead to loss of capital. Past results are no guarantee of future results. Trading stocks and CFD's can yield large rewards, but also has large potential risks. Trading with leverage can be especially risky. You should be fully aware of the risks of trading in the capital markets. You are strongly advised not to trade with capital.
|