| Weekly Outlook In The Stock Market |
| By Price Headley |
Published
07/28/2008
|
Stocks
|
Unrated
|
|
|
|
Weekly Outlook In The Stock Market
NASDAQ Composite
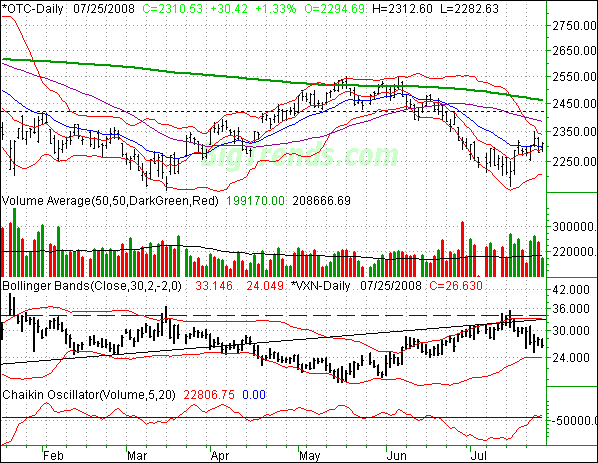
The NASDAQ rallied 1.33% on Friday, up 30.42 points to end the day at 2310.53 for the session. That meant a 1.22% gain for the week, up 27.75 points from the prior week's close. Overall, we're bullish here, but also on the sidelines at this point.
This is kind of an interesting duality; we're a little bullish on the NASDAQ, but a little bearish on the other indices (but yes, they two ideas can co-exist).
Here's why we're mostly bullish here...
The VXN - it's still trending lower, which is bullish for stocks.
Momentum - the NASDAQ ended the week above the key short-term average lines.
Volume - except for Friday, the rally has been pretty well supported. (Note this is not the case for the other indices.)
That said, there's a lot of limbo here. The Bollinger bands are really tightening, and the composite has yet to pressure on side or the other. A move above 2350 would be bullish (though only until 2450 or so), while a tumble under the 10/20 day lines could set up a move back to the lower band at 2207. We're not looking for a lot of net movement (or any decisive movement) until those boundaries is broken. Instead, we may just bounce around for a while.
The VXN may be more telling on that front, though even it - right now anyway - isn't indicating much. (It did call the bottom from the 15 though.) When it gets to 24, then we'll start to scrutinize.
NASDAQ Composite Chart - Daily

S&P 500
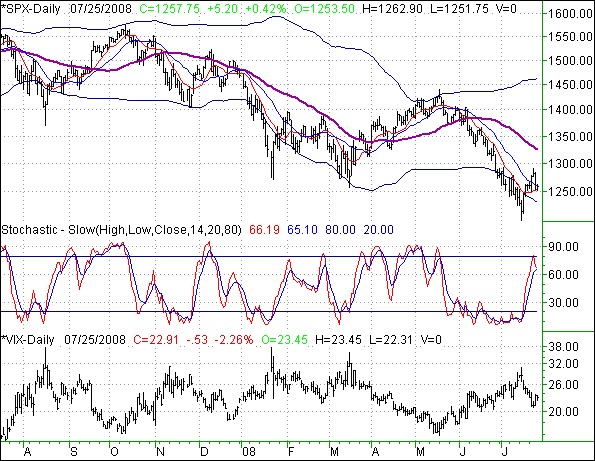
The S&P 500 gained 0.42% on Friday, up 5.2 points. On a weekly basis, the large cap index barely closed in the red: 2.95 points (-0.23%) below the previous Friday's closing level. At this point, the SPX could go either way.
If we has to guess, we'd say the S&P 500 is more apt to head lower than higher from here (unlike the NASDAQ, but like the Dow, as you'll read below). It's stochastically overbought, and the upswing faltered well before it made any real progress.
The upside for the bulls is that the index found support at the 10 and 20-day lines. But, it's still not enough. A move to 1300 would wipe away the big selloff from Thursday, and could prompt more upside. A slide under the 10/20 day averages could really send us tumbling.
In short, we're waiting here.
S&P 500 Chart - Daily

Dow Jones Industrial Average
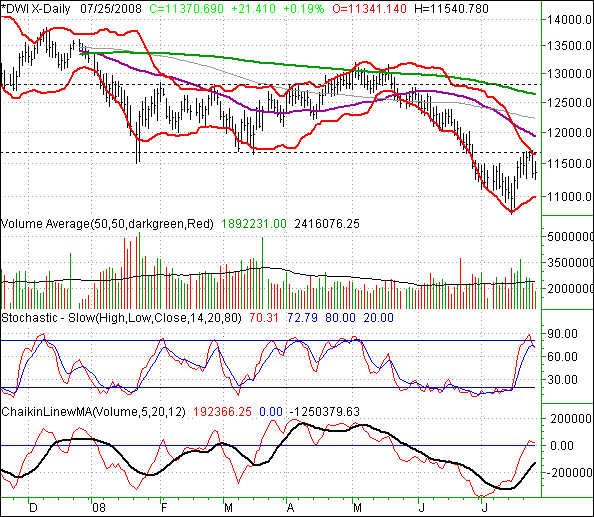
The 0.19% gain (+21.41 points) for the Dow on Friday left it at 11,370.69. That was still a 1.09% loss (-125.88 points) for the week though. And, based on how we left off, the Dow's actually telling us more downside is on the way.
The primary reason we think this? Take a look at the Bollinger bands (red). The Dow ran into the upper band in the middle of last week, and immediately got sent lower. Had the Bollinger bands not been such precise guides for the Dow, it may not mean much. But, you can see how the Dow's been pin-balled between them. If histry holds true, the Dow is on track to move to 10,977. Once there, we'll reassess.
The other reason we're bearish? Stochastically oversold.
Eventually, the Dow will rise for a while; the upper band line should act as a guide then too. We aren't at that point yet though.
Side note - the volume faded pretty quickly from the uptrend. It will need to pick up again (and stay firm) of any rally is to have longevity.
Dow Jones Industrial Average Chart - Daily

Price Headley is the founder and chief analyst of BigTrends.com.
|