| Corcoran Technical Trading Patterns For July 29 |
| By Clive Corcoran |
Published
07/29/2008
|
Stocks
|
Unrated
|
|
|
|
Corcoran Technical Trading Patterns For July 29
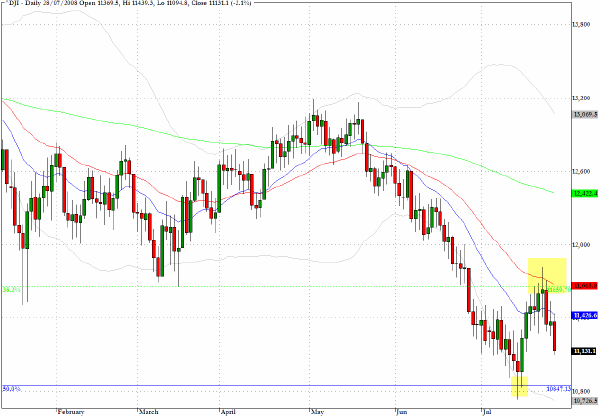
In a low-volume session, the sell-off gained momentum as there seemed to be an absence of both new buying and short-covering to support prices. The Dow Jones Industrials (^DJI) lost more than two percent and all of the broad indices suffered as financials came under renewed pressure.
As can be seen below on the daily chart, the index is in the middle of the important zone between the 38% and 50% retracement of the October 2007 high and the March 2008 low. The move down in early July took us below the 10750 level intraday but one senses that a more thorough testing could now be on the horizon.
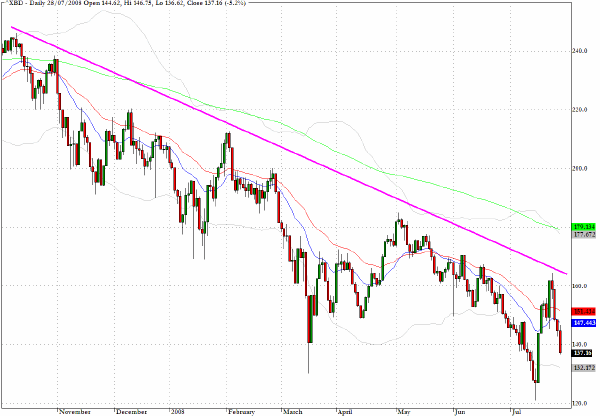
The rally in the financials has fizzled and the investment banks (^XBD) stalled exactly where the downward trendline suggested they would. The bulls may try to get mileage today from the notion that Merrill Lynch's (MER) eye-watering write downs represent a turning point etc. but this story has been used quite a lot over the last few months and, apart from short-term trading profits, it has not been profitable for institutions that believe that the banks are a compelling buy at these depressed levels.
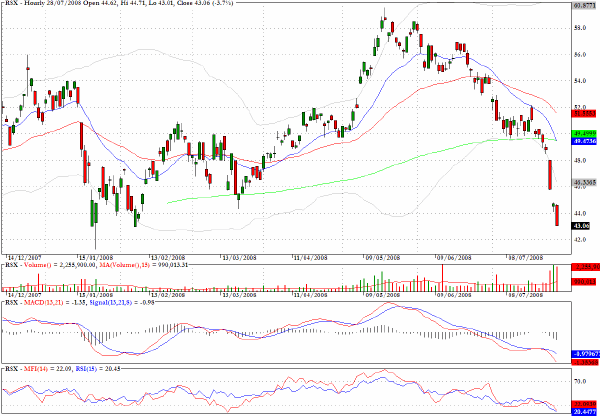
Mentioned here last week and also on CNBC Europe last Friday, the exchange traded sector fund that comprises several key Russian equities, RSX, has continued its decline. The early 2008 lows are back in play and could provide some support, but given the deteriorating fundamentals and increased political risk, this geographical sector is becoming less attractive to hedge funds.
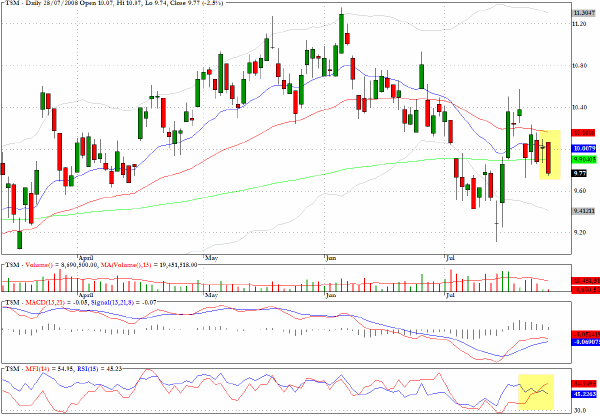
Even though Taiwan Semiconductor (TSM) dropped below its 200-day EMA in yesterday's trading, the chart pattern appears constructive from a money flow perspective.
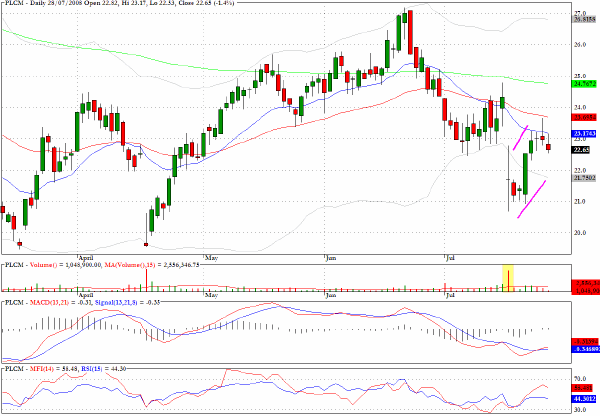
Polycom (PLCM) has pulled back since the large down gap move in mid-July and should encounter renewed selling in the region between $23 and $24.
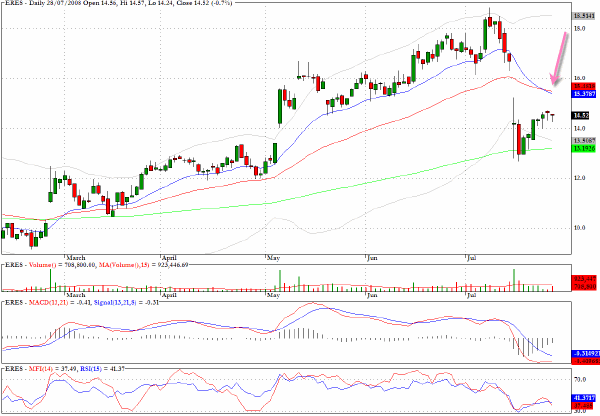
The $15.50 area should provide a strong hurdle for eResearch Technology (ERES).
Clive Corcoran is the publisher of TradeWithForm.com, which provides daily analysis and commentary on the US stock market. He specializes in market neutral investing and and is currently working on a book about the benefits of trading with long/short strategies, which is scheduled for publication later this year.
Disclaimer
The purpose of this article is to offer you the chance to review the trading methodology, risk reduction strategies and portfolio construction techniques described at tradewithform.com. There is no guarantee that the trading strategies advocated will be profitable. Moreover, there is a risk that following these strategies will lead to loss of capital. Past results are no guarantee of future results. Trading stocks and CFD's can yield large rewards, but also has large potential risks. Trading with leverage can be especially risky. You should be fully aware of the risks of trading in the capital markets. You are strongly advised not to trade with capital.
|