| The McMillan Options Strategist Weekly |
| By Lawrence G. McMillan |
Published
08/1/2008
|
Options
|
Unrated
|
|
|
|
The McMillan Options Strategist Weekly
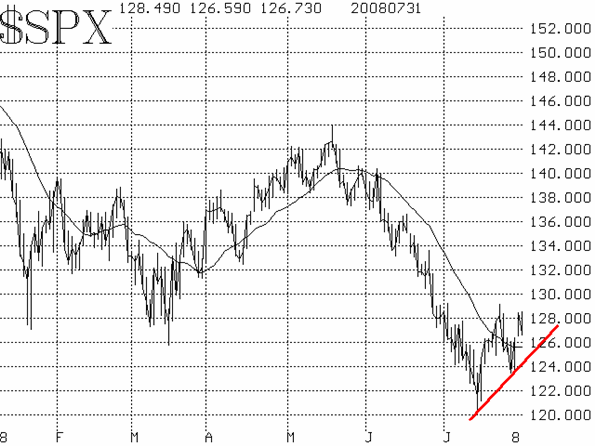
There have been large swings in both directions in the last week. In fact, of the last six trading days, five have seen $SPX net changes -- on a closing basis -- of 17 points or more. Even so, it appeared that the bulls were going to take charge, but they seem to have failed. After the oversold rally which ended last week, the market pulled back early this week, and then rallied. That pullback bottomed out at 1234 on $SPX, there making a "higher low" (the low of the previous week was at 1200). Then, on Wednesday (yesterday), $SPX rallied strongly, closing at a new high for this rally, at 1282. That made a "higher high" on a closing price basis, although not on an intraday basis. A pattern of higher highs and higher lows is bullish for the $SPX chart.

However, that configuration was dealt a blow by today's negative action -- thanks mostly to very negative comments by ex-Fed chief Greenspan (the market had pretty much weathered early selling, caused by worse-than-expected GDP growth). With today's pullback, the $SPX chart looks more like it has even heavier resistance at 1280, as opposed to what looked like a bullish pattern yesterday. But the "higher low" is still in place, and there are some buy signals from the technical indicators, so the bulls may still be able to take control.
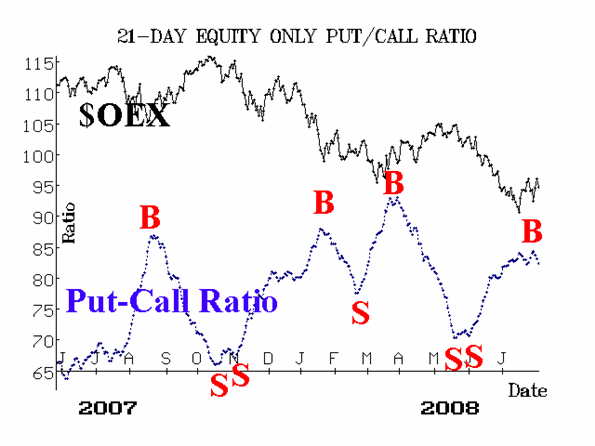
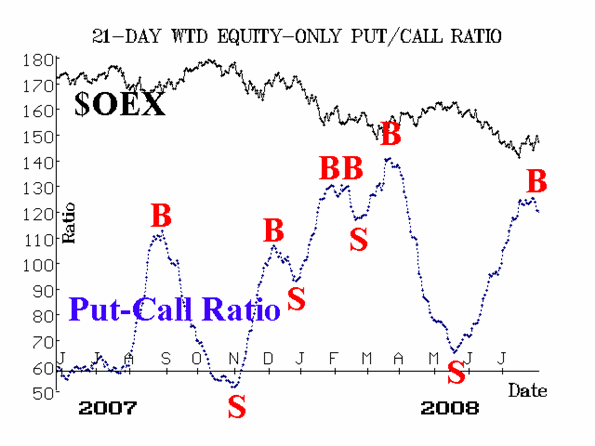
The equity-only put-call ratios have both turned bullish (see Figures 2 and 3). That is certainly important, as these intermediate-term indicators have a strong track record. Moreover, these buy signals arose from fairly lofty levels on their charts -- usually an indication of a signal with a high probability of success.


Market breadth has been volatile, just like the market. Despite today's negative action, breadth is currently on a buy signal -- generated by the strong number of advancing issues on Tuesday and Wednesday of this week. This is usually a confirming indicator, and as such it is confirming the bullishness of the equity-only put-call ratios.
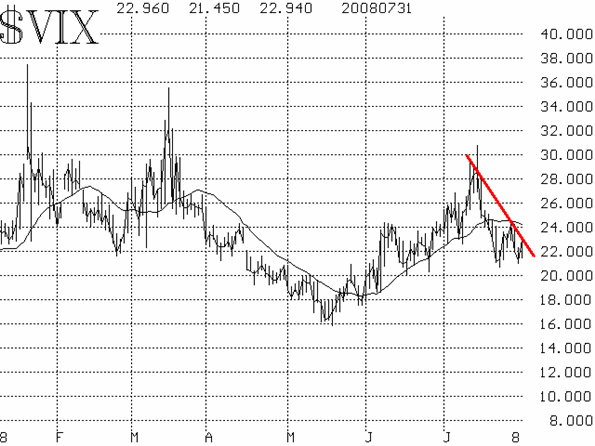
The volatility indices ($VIX and $VXO) have made some sharp moves, but the general tend is lower, and that's bullish. However, recently $VIX has been bouncing around in a range between 21 and 24. A close below 21 would confirm a bullish market, but a close above 25 would change the $VIX chart to bearish. At this point, its last signal was a buy signal, and it hasn't negated that, so technically $VIX is on a buy signal -- merely by the fact that it's in a general down trend. Note that its 20-day moving average is rolling over and beginning to turn downward. That's bullish, too (Figure 4).

In summary, we don't have any sell signals, and the fact that the equity-only put-call ratios have recently turned bullish is significant. Moreover, the other indicators are modestly bullish. As a result, we favor the upside here, but it looks like there won't be complete confirmation from the $SPX chart unless it trades above 1291 -- the July 23rd high. Of course, if the lows at 1200 are violated, then all bullish thoughts are to be abandoned, for that would be extremely bearish.
Lawrence G. McMillan is the author of two best selling books on options, including Options as a Strategic Investment, recognized as essential resources for any serious option trader's library.
|