| Weekly Outlook In The Stock Market |
| By Price Headley |
Published
08/3/2008
|
Stocks
|
Unrated
|
|
|
|
Weekly Outlook In The Stock Market
NASDAQ Composite
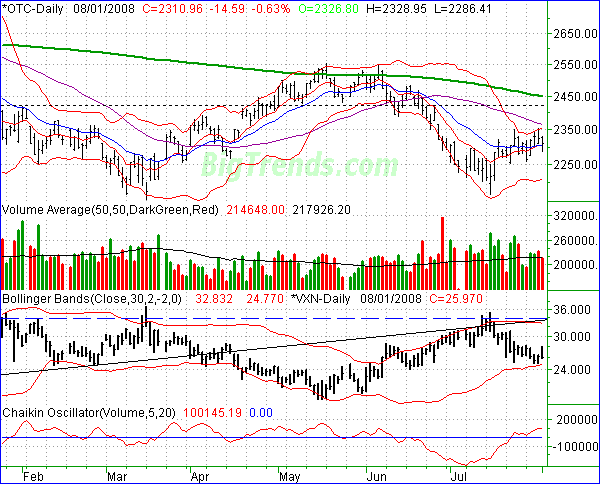
The NASDAQ's close at 2310.96 on Friday was the result of a 14.59 point (-0.63%) loss. For the week though, the composite managed to eke out a slight gain of 0.02%, 0.43 points above the prior week's close. We won't be nearly as optimistic about the other two indices as we are the NASDAQ, but we have to call a spade a spade.
The NASDAQ has moved back above both the 10- and 20-day averages. And, it's fought to stay there. And, the 10-day line is crossing above the 20-day line. Some of that can be said about some indices, but not all of it can be said about all the indices. Ergo, the NASDDAQ is technically the strongest index right now. That's commensurate with a bullish environment, when the NASDAQ leads. That doesn't necessarily give us a rice target for the composite though. It's just a broad tone.
As we'll be saying with all the indexes, there's not a lot to offer right now. Instead, we can only watch for certain things to act as clues. Those include the VXN. It looked liked the VXN was going to make good on an upside reversal effort Friday, but late in the day we saw the VXN fall back again. It's generally pointed lower; if it attacks its lower band line again. See March through May for an example.
It also includes volume. The bullish volume has waned slightly, but the bearish volume has been tepid. One side or the other needs to step in en masse.
From here, we're waiting to see what happens at the 50-day moving average line (purple) at 2369. The composite is on approach to there right now. A move above it could spark some buyingn though only up to the 200-day line at 2449.
NASDAQ Composite Chart - Daily

S&P 500
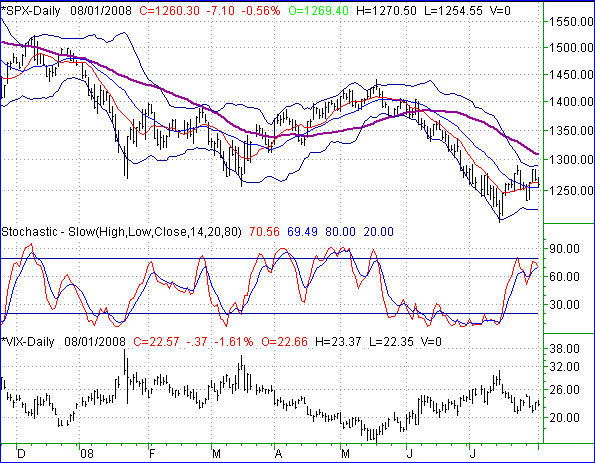
Losing 7.10 points on Friday (-0.56%), the S&P 500 sank to 1260.30. For the week, the large cap index still managed to hold onto a gain of 2.55 points (+0.2%). Yet, the S&P is pretty much caught between a rock and a hard place.
Check out the 10- and 20-day moving averages: the thin red and blue lines, respectively. The SPX closed above the 20, and under the 10. Now check out the 20-day Bollinger bands, at 1290 and 1221. The index is squarely in the middle of all of that. Hence, it's pointless -- even dangerous -- to try and make assumptions based on the look of the chart.
If we were looking at stochastics, we'd have to hesitantly say the index looked a little more bearish than not. We're still hearing the echoes of the recent encounter with being overbought. And, the VIX is also somewhat bearish, in that we're starting to see higher highs. But, neither of those hints are all that strong.
The only tool of real value we've seen lately is the 50-day moving average line (purple). Crossing it has been a successful buy/sell signal. More importantly though, we've seen that 50-day line act as a floor and a ceiling, not allowing the SPX to cross it.
That kind of puts a damper on using it today. The index is about 50-points under it, meaning there's no clue to be derived. But, sometimes it's best to not make something out of nothing. Stay patient here.
S&P 500 Chart - Daily

Dow Jones Industrial Average
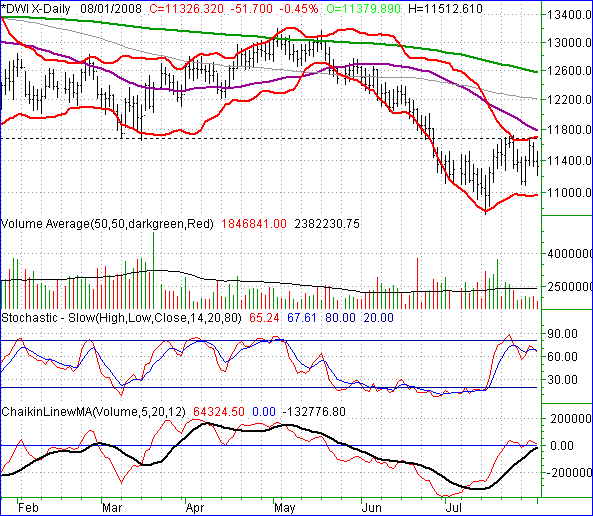
The Dow fell 0.45% on Friday, losing 51.7 points to close at 11,326.32. On a weekly basis, the blue chip index closed 44.37 points under (-0.39$) the previous Friday's closing level, the only index to end the week in the red.
Draw this line on your charts: 11,686. That's pretty much where the Dow peaked a couple of times in the last three weeks, and it's also where the upper Bollinger band (20 day, +/- 2 sds) is now. That upper band is a particular concern, as it's already been verified as a resistance area with each of those peaks. Until that line is crossed, we can't get too enamored by any bullishness. Other than that there are no direct hints about the market's next move, but we're getting some indirect hints from volume data.
First and foremost, the bullish volume faded as the week wore on. Technically, you could argue that the Chaikin line (red) and its moving average line (black) were bullish in that they were both making their way above the zero level , but take a closer look. The actually Chaikin line -- the lead line -- is about to fall back under zero as well as fall back under the moving average line. All in all, this most likely points to weakness. That said, the lower Bollinger band line at 10,961 is still a big support level.
Dow Jones Industrial Average Chart - Daily

Price Headley is the founder and chief analyst of BigTrends.com.
|