| Corcoran Technical Trading Patterns For August 5 |
| By Clive Corcoran |
Published
08/5/2008
|
Stocks
|
Unrated
|
|
|
|
Corcoran Technical Trading Patterns For August 5
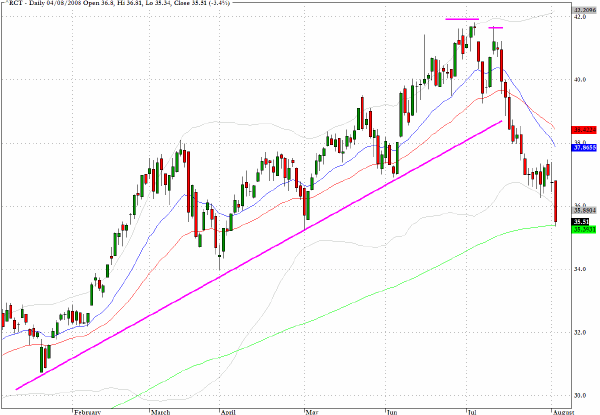
The correction in the commodities markets is gathering momentum after the quite noticeable lower top that was posted in early July. The Rogers Commodity Index (^RCT) reveals the across-the-board weakness in commodity prices yesterday. While the 200-day EMA could provide some short term relief from fund selling, there should be lower prices ahead before there are obvious chart levels of support.
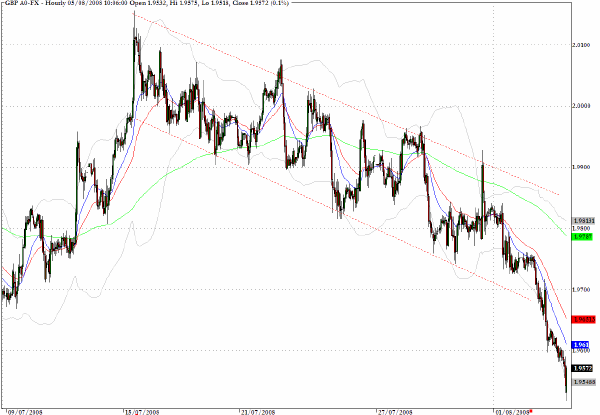
Sterling is heading further down following the breakdown characteristics that I discussed here last week and on CNBC last Friday.
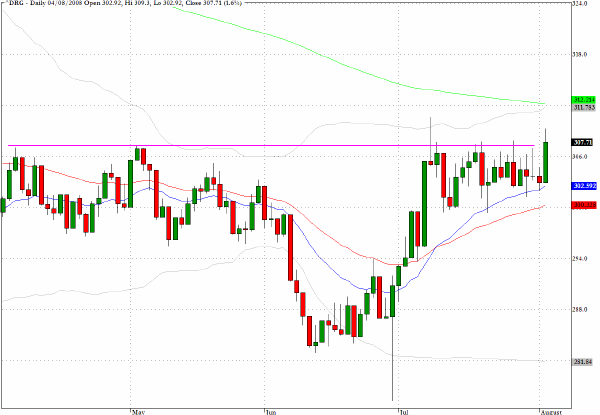
The pharamaceuticals index (^DRG) still looks poised for an upward breakout.
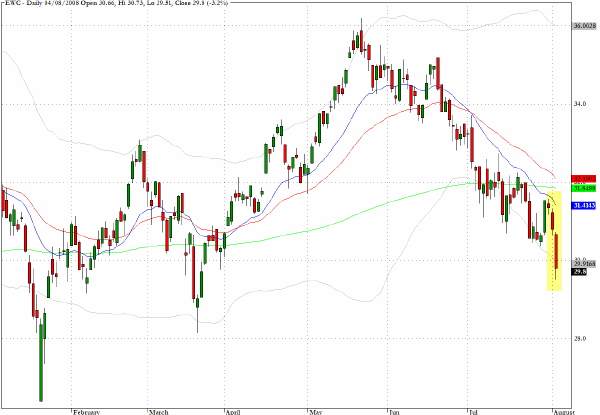
A couple of weeks ago in this commentary the following was noted in regard to one potential fallout from the commodity correction.
Resource-focused economies/stockmarkets will be relatively more exposed to a contraction in world demand for commodities. Yesterday, EWC, which tracks the MSCI Canada index, fell below key support at the 200-day EMA on expanded volume.
The MSCI Canadian index dropped more than three percent in yesterday's trading and should be a relative under-performer in the intermediate term.
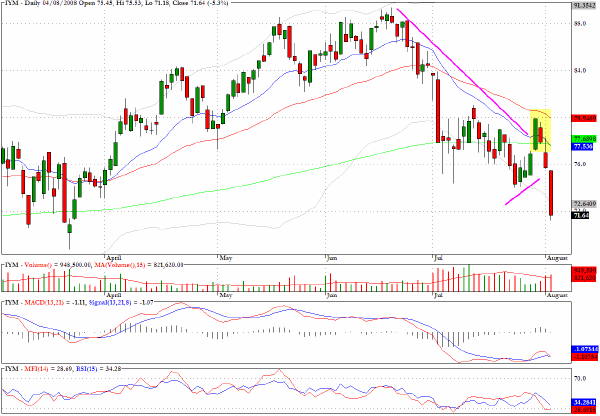
IYM, the exchange traded fund which consists of key stocks in the industrial materials sector, after congestion at the 200-day EMA and the rather pronounced triangular pattern, produced the breakout that the pattern was pointing to. But as with many other recent charts the initial reaction was a fake move to the upside followed by a sharp drop yesterday as the deteriorating fundamentals are becoming harder to avoid.
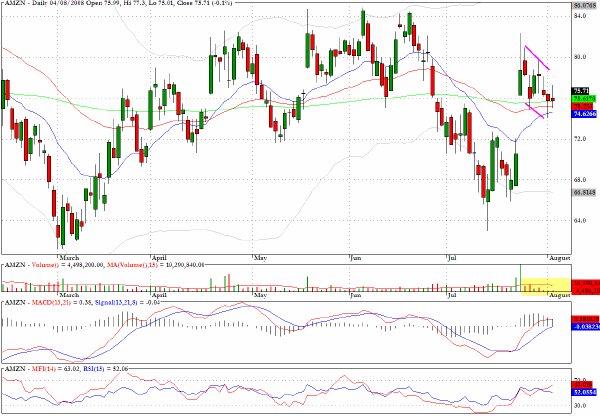
Amazon (AMZN) has pulled back to an attractive area on the long side.
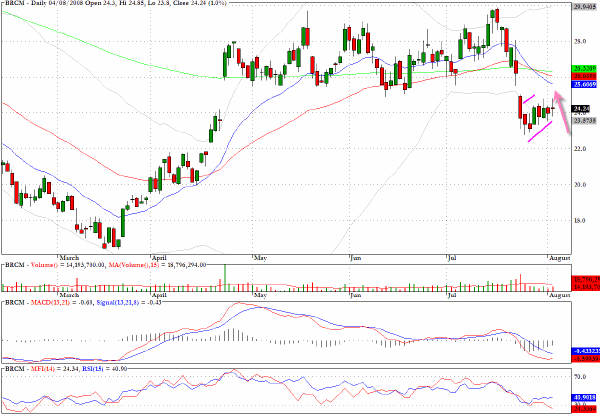
Broadcom (BRCM) faces stiff overhead resistance at the conjunction of all three moving averages.
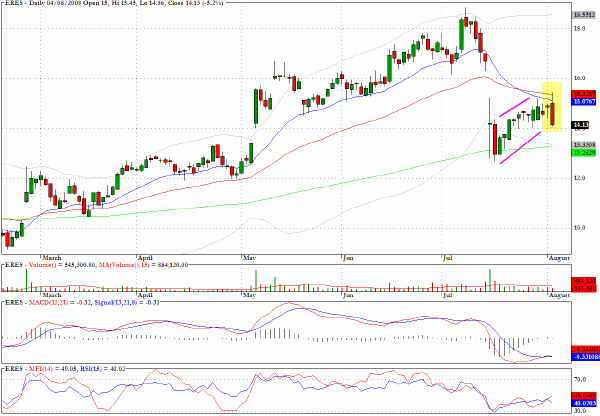
As anticipated, the $15.50 area did provide a strong hurdle for eResearch Technology (ERES).
Clive Corcoran is the publisher of TradeWithForm.com, which provides daily analysis and commentary on the US stock market. He specializes in market neutral investing and and is currently working on a book about the benefits of trading with long/short strategies, which is scheduled for publication later this year.
Disclaimer
The purpose of this article is to offer you the chance to review the trading methodology, risk reduction strategies and portfolio construction techniques described at tradewithform.com. There is no guarantee that the trading strategies advocated will be profitable. Moreover, there is a risk that following these strategies will lead to loss of capital. Past results are no guarantee of future results. Trading stocks and CFD's can yield large rewards, but also has large potential risks. Trading with leverage can be especially risky. You should be fully aware of the risks of trading in the capital markets. You are strongly advised not to trade with capital.
|