NASDAQ COMMENTARY
A special note about the NASDAQ Composite today.
Celgene (CELG), a key component of the composite, has halted trading today. The FDA Oncologic Drugs Advisory Committee is review the company's NDA for Revlimid, and the exchange has decided to stop trading in this issue, as the speculation around the FDA's determinations will assuredly create more volatility than the market can tolerate. The trade stoppage is not an unusual action. What is unusual is that the last reported trade price for CELG shares was 20 cents....it closed at 52.91 yesterday. As a result, many data services are reporting that Celgene shares are down nearly 100%. Being a NASDAQ stock, this had a particularly negative effect on the reported levels of the NASDAQ Composite index this morning. Mental adjustments are being made, now that the market is aware of the trade halt. However, the last trade price of 20 cents for Celgene appears to be the price being used for the composite's calculation. Once trading starts again, that price could be back up to the 50 area, and would wipe away some of the losses the NASDAQ is taking today. For that reason, take the NASDAQ's losses (so far) with a grain of salt.
That said, we still have to look at the chart, as there are nearly 4000 other stocks besides Celgene that are included in the composite (although Celgene is a big one among them).
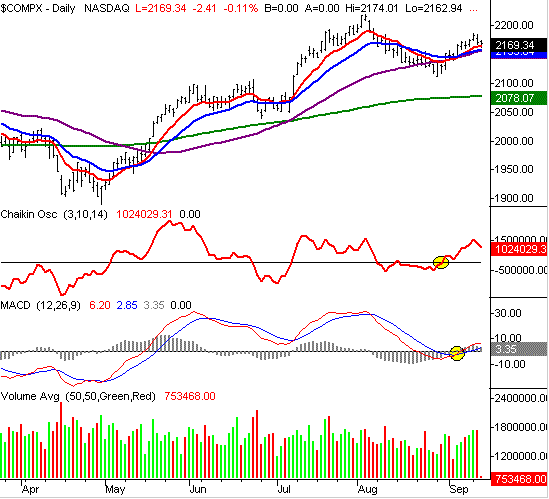
As of right now, the limits are being tested (so to speak). The NASDAQ is in the red.....slightly. The low of 2162.94 is just a hair under where the 10 day line is parked, and is likely to be one of the reasons the index was able to recover as well as it has. On the other hand, today we've seen our second lower low, and so far, our second lower high. This isn't exactly bullish. We can tolerate a pause during an uptrend, but there's a striking lack of follow through since we crossed back above the 10 and 20 day lines a couple of weeks ago. More than that, yesterday's selling volume was relatively high. And even more than that, most of the buy signals we saw last week are already starting to crumble. In other words, we're not so bullish anymore (unless the Celgene correction can pull the index up by the bootstraps).
We had been comparing this cross above the short-term averages to the same cross from mid-May and mid-July. Both of those were bullish, and with all the similarities, we thought this one could be as well. But like we mentioned above, there's a major lack of follow-through.....we never saw anything quits as problematic in the May and July rallies.
So now the game is one of waiting. The NASDAQ is still above the 10 day line (red), and as long as it is, the trend will remain technically bullish. On the other hand, we're not exactly seeing this dip today as a prime buying opportunity. In this case, we'd definitely wait for a breakout move. Support is at 2165 and 2159. Resistance is at 2187. Anything happening between those levels could just be considered volatility.
NASDAQ CHART - DAILY

S&P 500 COMMENTARY
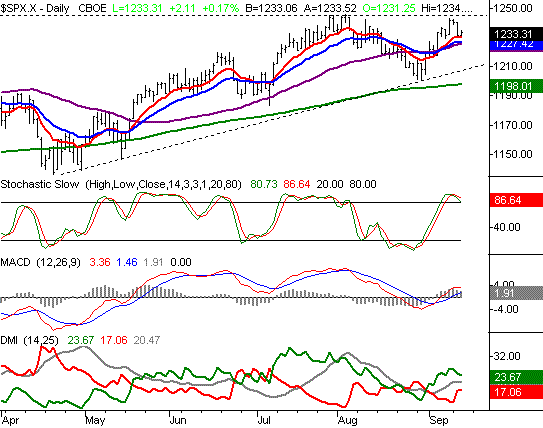
The S&P 500 is actually in the plus column today, also finding support at the 10 day moving average. However, this chart is equally uninspiring for the bulls. We saw a pretty low open, a small rally that faded quickly, and the index is now struggling to even hold onto half of its intra-day gains. We saw 1234.74 for a moment shortly after the open, but we've pulled back to 1233 (and change) since then.
Like the NASDAQ, we're seeing many of the buy signals made just a few days ago start to unwind, as the index itself starts to make lower lows and lower highs. All of the signals are still technically bullish, and there actually aren't any of the usual technical sell signals in place yet. However, we may be seeing the proverbial writing on the wall. The stochastics indicator is on the verge of falling back under 80, the MACD lines are rolling over, and the DMI lines are starting to converge again - but in a bearish way this time.
On the other hand, none of the buy signals have been negated, nor have any sell signals been made. While it may not feel right to remain bullish, we have to have the discipline to stick with our signals until we have a valid reason not. The next potential reason not to do so would be a tumble back under the 10 day line, currently at 1231. But even that one isn't alone.........the 20 day line at 1227 will be the final short-term bull/bear signal line right now.
From a bigger-picture perspective, the resistance around 1245 is turning out to be a huge deal. We highlighted that possibility in Tuesday's TrendWatch, and sure enough, it came into play for the second time in two months. Like we said then, it's only a few points away. So, any movement between the current support/resistance zone is not all that significant. We're waiting for a bigger breakout to trade new positions. In the meantime, we're still mildly bullish based on this chart.
S&P 500 CHART - DAILY

DOW JONES INDUSTRIAL AVERAGE COMMENTARY
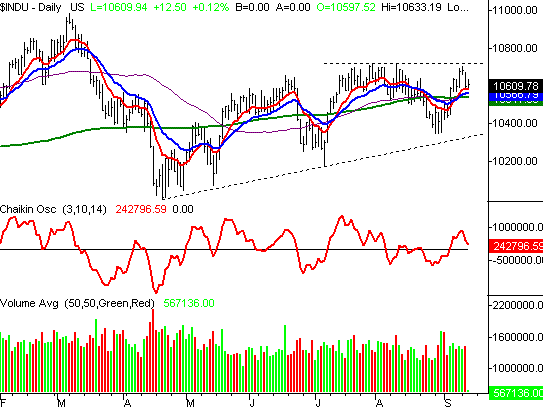
The Dow's chart pretty much tells the same story you read above, so we'll be short and sweet here. The resistance around 10,700 was indeed a problem level again. We got as high as 10,701 on Monday, but have managed to give up nearly 100 points since then. And yes, like above, the 10 day moving average at 10,589 seems to be the floor, at least for the time being.
So, trapped between a rock and a hard place, the Dow is stuck in fairly tight range. The momentum is still technically to the upside. Note that the Chaikin line is pointed sharply lower, which is in sharp contrast to the bullish cross we saw just last week. It's a small nuance, but one we're going to watch closely the rest of the week. In fact, all the little red flags that start waving prior to a dip are also popping up. We shall see.
DOW JONES INDUSTRIAL AVERAGE CHART - DAILY

BOTTOM LINE
The one thing we didn't mention above is Friday's option expiration. It's actually a triple-witching month, which can wreak a unique kind of havoc in the market. That's got to be a big part of the reason that the market was reeled after a very solid two weeks of bullishness. The result of an expiration week, though, may linger well past the actual expiration date. If enough damage is inflicted this week, that may be enough to drive investors and traders out of stocks altogether, including next week. So, where we close this week will be immensely important. As long as we can hold tight above the 10 day lines, we'll stay bullish, but we'd really like to see a break above recent resistance levels to get truly excited. On the flipside, a close under the 20 day lines would likely set up some short-term pain for stocks.
Price Headley is the founder and chief analyst of BigTrends.com.