| Corcoran Technical Trading Patterns For August 7 |
| By Clive Corcoran |
Published
08/7/2008
|
Stocks
|
Unrated
|
|
|
|
Corcoran Technical Trading Patterns For August 7
Helping to drive the rally in equities are the twin (and related) forces of declining commodity prices and the newly energized dollar. Yesterday I noted the intraday pattern seen in early European trading which showed the US currency breaking above resistance against the yen, and it went on to record further strong gains in the US trading session allowing the dollar to record its strongest close against the yen since early January.
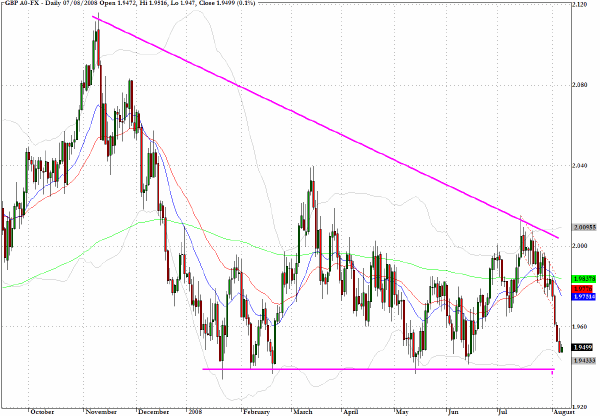
Also mentioned here in several recent commentaries, sterling is now facing a bearish-looking pattern as it moves into the apex of a descending wedge pattern. On the daily chart the $1.9750 level now seems to be a key barrier, and I suspect any rally above it would provide an excellent selling opportunity. Downside targets around $1.90 are now in play.
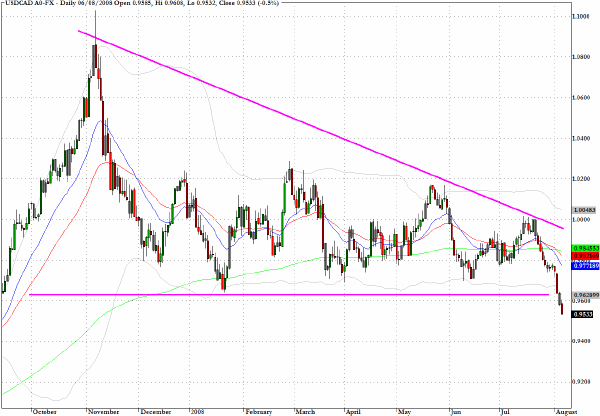
Further illustrating the new found dynamism of the US dollar is the daily chart below for the the Canadian dollar. The selling could be a little overdone in the near term, but the chart points to a clear turning of the tide for this cross rate.
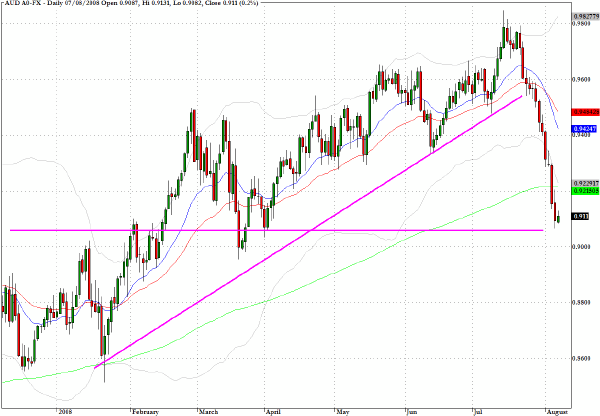
The Australian dollar has tumbled precipitously in recent sessions and although the 200-day moving average did not check the decline there is some chart support in the vicinity of yesterday's close.
Exchange traded funds provide liquid instruments for taking positions in all of the major currency rates mentioned including FXA which tracks the Aussie dollar.
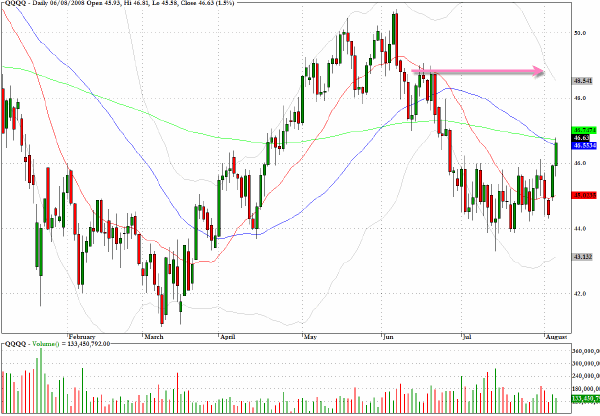
QQQQ has to confront the convergence of the 20 and the 200-day EMA at current levels which may prove to be a short term obstacle. A more important test lies at the $48.50 level which, following the late May/early June high, proved to be a difficult hurdle to recovery efforts, and this level also coincides with the upper 40-day Bollinger band.
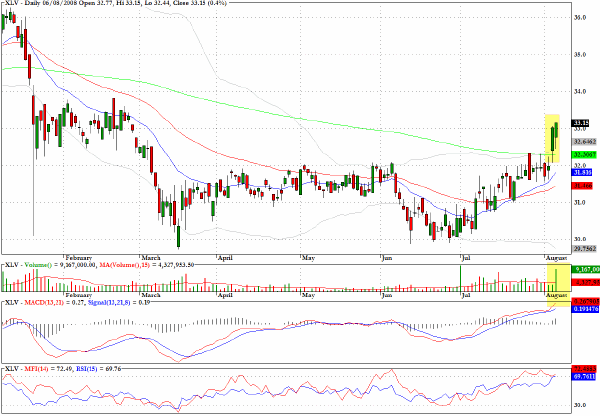
Confirming the upward breakout in the health care sector, XLV, yesterday's continuation pattern was on twice the average daily volume. The sector has broken decisively through 200-day moving average resistance and upside targets around $36 now seem attainable.
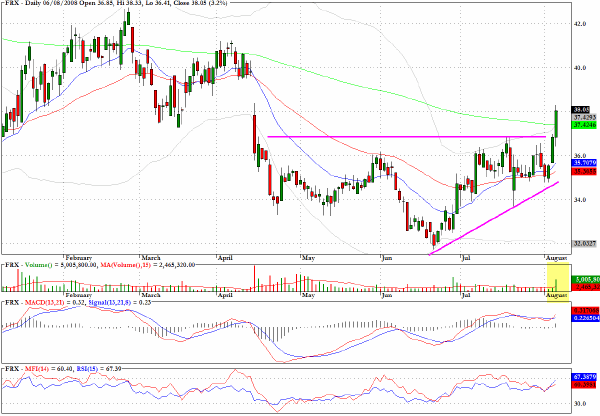
Forest Labs (FRX) shows the kind of pattern that is seen on a number of charts in the health care/pharmaceuticals sector.
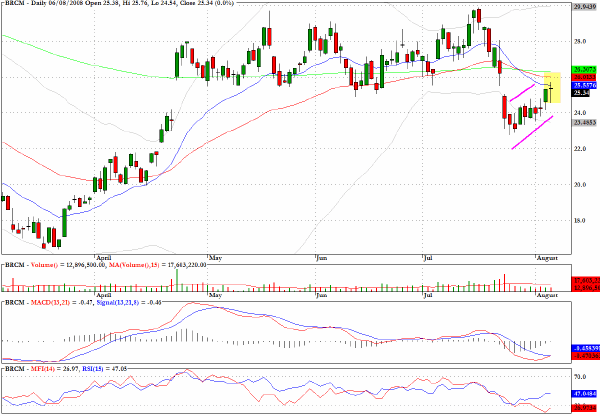
Earlier this week it was noted that Broadcom (BRCM) faces stiff overhead resistance at the conjunction of all three moving averages. The bearish flag formation has evolved further and yesterday's doji star/spinning top pattern on reduced volume could mark the turning point.
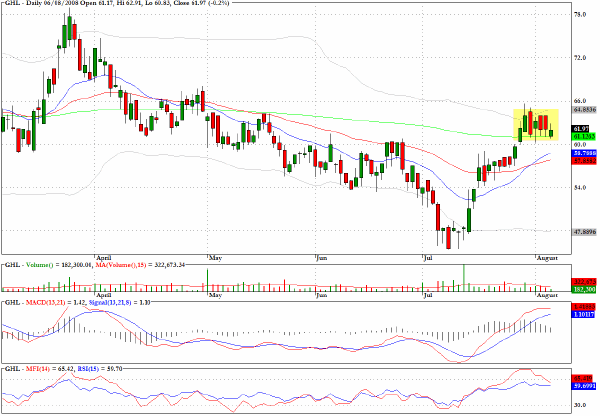
Greenhill (GHL) has a horizontal version of the bullish flag/consolidation pattern just above the 200-day EMA.
I shall be taking some time off to recharge the batteries and will return on August 18.
Clive Corcoran is the publisher of TradeWithForm.com, which provides daily analysis and commentary on the US stock market. He specializes in market neutral investing and and is currently working on a book about the benefits of trading with long/short strategies, which is scheduled for publication later this year.
Disclaimer
The purpose of this article is to offer you the chance to review the trading methodology, risk reduction strategies and portfolio construction techniques described at tradewithform.com. There is no guarantee that the trading strategies advocated will be profitable. Moreover, there is a risk that following these strategies will lead to loss of capital. Past results are no guarantee of future results. Trading stocks and CFD's can yield large rewards, but also has large potential risks. Trading with leverage can be especially risky. You should be fully aware of the risks of trading in the capital markets. You are strongly advised not to trade with capital.
|