| The McMillan Options Strategist Weekly |
| By Lawrence G. McMillan |
Published
08/8/2008
|
Options
|
Unrated
|
|
|
|
The McMillan Options Strategist Weekly
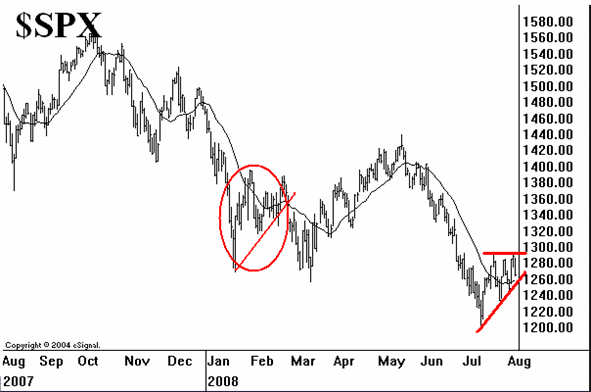
This is a market that has had plenty of opportunity to rise strongly, but has really been unable to do so. Even so, the current trend is mildly bullish. $SPX has carved out a series of higher lows -- at 1234 and 1247 -- which, when connected with the July bottom at 1200, form a rising trend line. As long as that trend line exists, the situation is positive. However, considering that nearly all of our indicators have simultaneously been on buy signals, the current rise is a weak one. It is perhaps most reminiscent of what happened just a few months ago -- in January (see Figure 1). At that time, the market bottomed in mid-January, after a massive oversold condition arose (partly as a result of Societe Generale dumping the positions of a rogue trader). That oversold rally generated only meek gains but lasted until the end of February, before another bout of selling (surrounding the run on Bear Stearns) took the market to new lows amidst another oversold condition.

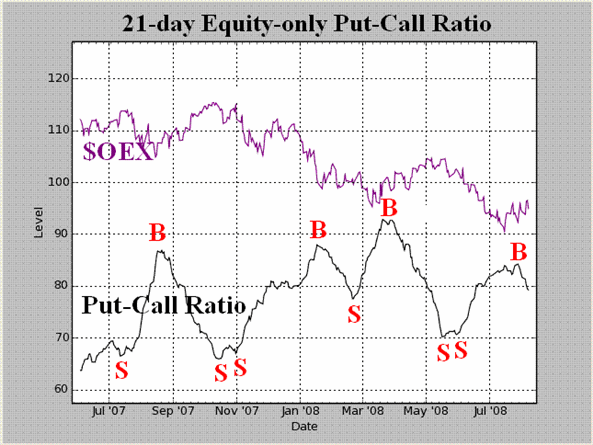
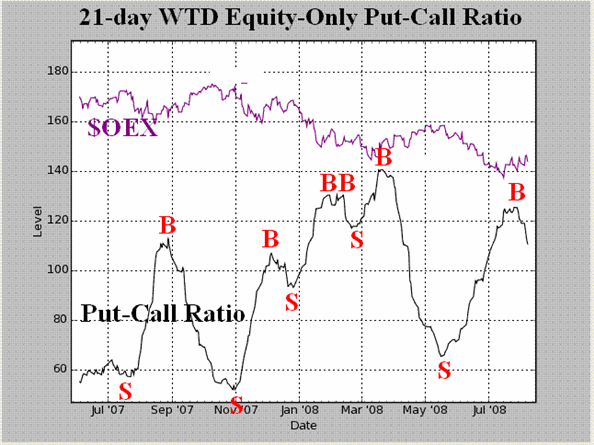
The equity-only put-call ratios are both still bullish, and as such they represent perhaps the most positive thing about this market right now. These buy signals came from fairly high levels on their charts, and that should be helpful. They will remain bullish until they roll over and begin to trend higher once again.

Market breadth (advances minus declines) has been lackluster on this rally. Typically, if this rally were the start of a new, truly bullish leg of the stock market, breadth would quickly register overbought conditions and remain overbought for quite some time during the initial phase of the rally. That has not happened.

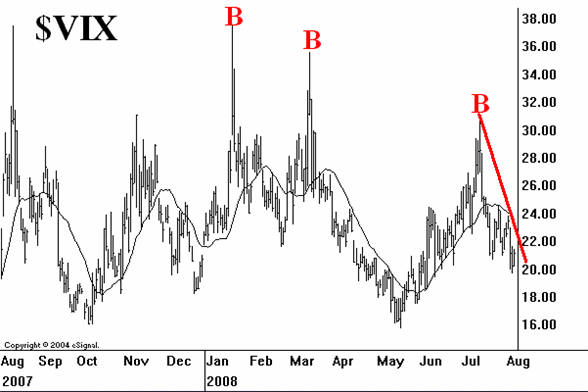
Volatility indices ($VIX and $VXO) have acted more bullish than most of the other indicators. $VIX has fallen sharply from the July highs, and that is bullish. Furthermore, it clearly made new relative lows (in contrast to $SPX, which has not clearly made new relative highs). Thus this down trend in $VIX is bullish. $VIX will remain bullish as long as it remains below 24.

In summary, we don't have any sell signals from our indicators. In fact, most of our indicators are bullish -- although some are rather tepid. As a result, we are retaining a bullish attitude -- an attitude, I might add, that has gone from enthusiastic to reluctant -- as long as $SPX remains above its bullish trend line. A close below 1247 would be negative, and a close below 1200 could be significantly bearish.
Lawrence G. McMillan is the author of two best selling books on options, including Options as a Strategic Investment, recognized as essential resources for any serious option trader's library.
|