| Equities Soar, Oil Slides |
| By Mike Paulenoff |
Published
08/8/2008
|
Futures , Stocks
|
Unrated
|
|
|
|
Equities Soar, Oil Slides
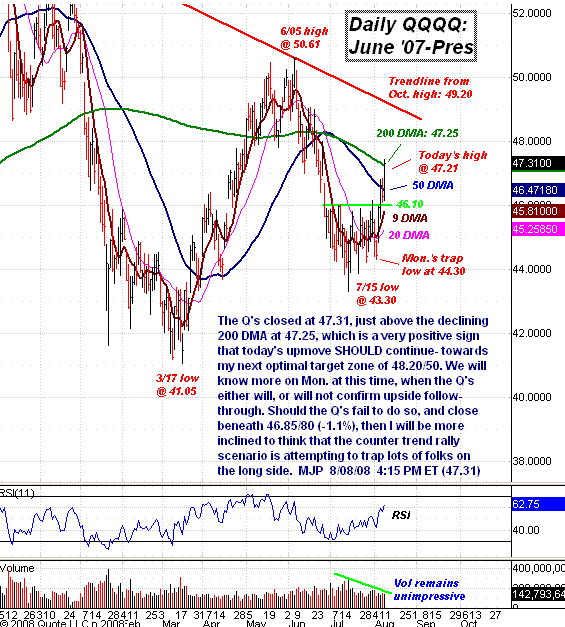
Equities are on a roll. Looking at the Nasdaq through the daily chart of the Nasdaq 100 Trust Shares (QQQQ), we see that the QQQQ closed at 47.31, just above the declining 200-day moving average at 47.25. This is a very positive sign that today's upmove should continue towards my next optimal target zone of 48.20/50.
We will know more on Monday at this time, when the QQQQ either will, or will not, confirm upside follow-through. Should the QQQQ fail to do so, and close beneath 46.85/80 (-1.1%), then I will be more inclined to think that the countertrend rally scenario is attempting to trap lots of folks on the long side.

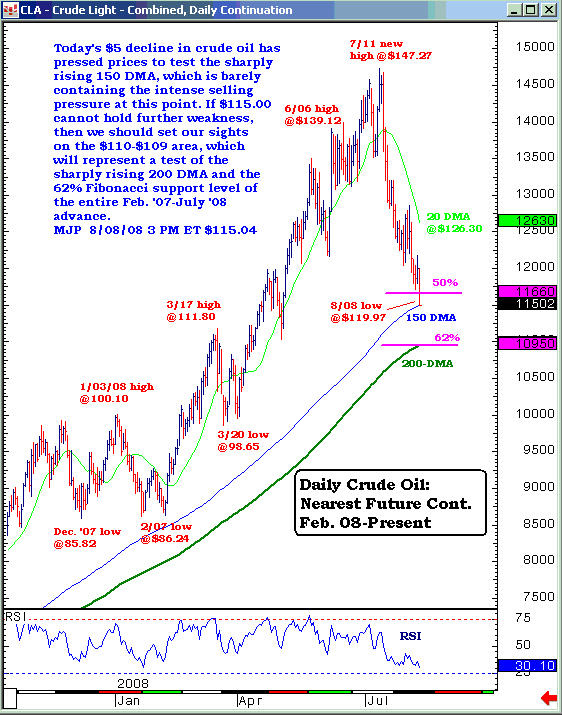
Meanwhile, oil is pressing lower. Friday's $5 decline in crude oil has pressed prices to test the sharply rising 150day moving average, which is barely containing the intense selling pressure at this point.
If $115.00 cannot hold further weakness, then we should set our sights on the $110-$109 area, which will represent a test of the sharply rising 200day moving average and the 62% Fibonacci support level of entire February 2007-July 2008 advance.

Mike Paulenoff is a 26-year veteran of the financial markets and author of MPTrader.com, a real-time diary of his technical chart analysis and trading alerts on all major markets. For more of Mike Paulenoff, sign up for a free 15-Day trial to his MPTrader Diary by clicking here.
|