| Weekly Outlook In The Stock Market |
| By Price Headley |
Published
08/11/2008
|
Stocks
|
Unrated
|
|
|
|
Weekly Outlook In The Stock Market
NASDAQ Composite
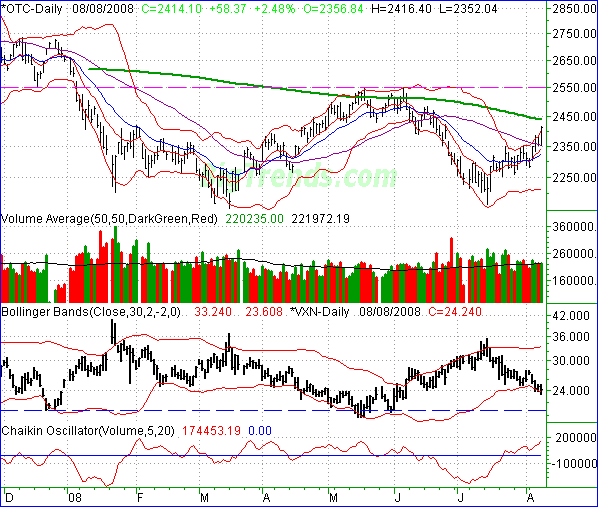
We watched the NASDAQ gain 2.48% on Friday (+58.37 points) to close out at 2414.10. For the week, that meant a 103.14 point gain, 4.46% above the previous week's closing level -- by far the biggest winner for the week. All well and good, but it also looks like there's a heap of resistance just above where we are now.
Everything is actually lining up pretty nicely for the NASDAQ: decent volume, the VXN is falling, and the bullish momentum is clear. However, the biggest hurdles are still in front of us.
To be totally fair, the NASDAQ is in better (more bullish) shape than the other indices. It's above all the intermediate-term moving averages, and knocking on the door of the 200-day line (green). Based on the relative strength NASDAQ (relative to the other exchanges), that's bullish in the bigger picture. The problems surface specifically with the chart.
Those problems are potential resistance at the 200-day line (at 2440), and then potential resistance at May's and June's peak of 2550. It's not clear which one of those was the problem back in May and June, but we have to assume it was at least one of them. (See the pink dashed line.)
There may be time though - enough time for the composite to at least get past the 200-day line. The VXN is NOT trying to make a rebound at the lower Bollinger band. Instead, it's pressing it lower. It may not find support until it hits 21.0 or so (it's currently at 24.0), which means the NASDAQ could rally for a while. In other words, the VXN may be more helpful in finding the top than the index is.
As for the downside, we'll assume the 10/20-day averages -- around 2333 -- will act as support until it's clear they won't. If they do break down, the NASDAQ is apt to fall, and fall hard. There's a lot of room between 2333 and the lower Bollinger band at 2210.
NASDAQ Composite Chart - Daily

S&P 500
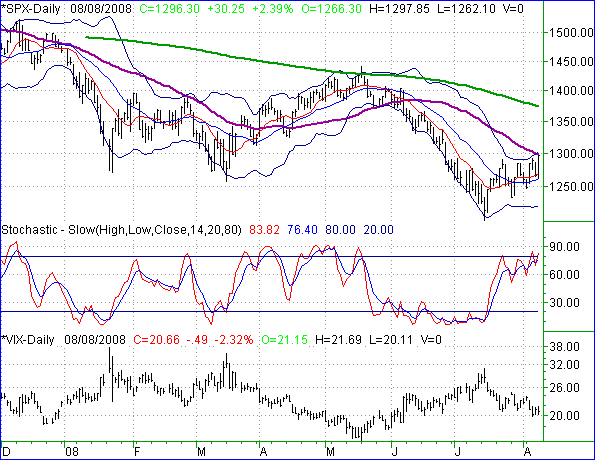
Nice rally for the S&P 500 on Friday as well, up 2.4%, or 30.25 points. The large cap index closed at 1296.30. On a weekly basis, the SPX managed to gain 36.0 point, or 2.86% above the prior Friday's close.
There's really only one unique observation we can make about the S&P 500's chart in the short run, it all hinges on the 50-day average (and even that's not all that unique - the Dow is wrestling its 50-day line too). The SPX stopped just short of it Friday. Given that the 50-day line has been resistance, support, and a pretty good buy/sell signal of late, all eyes are on 1230.
If it breaks, we'll look for the index to make its way back up to the 200-day line at 1375. If it doesn't break, the SPX will need to fall under 1261 to start a breakdown, and even then the lower Bollinger band is at 1220.
Point being, the potential upside move is bigger than the potential downside move. As for which move is more likely to pan out, that's a coin toss. The S&P 500 is very much caught between a rock and a hard place (the 10- and 20-day lines on the bottom, and the 50-day average on the top).
S&P 500 Chart - Daily

Dow Jones Industrial Average
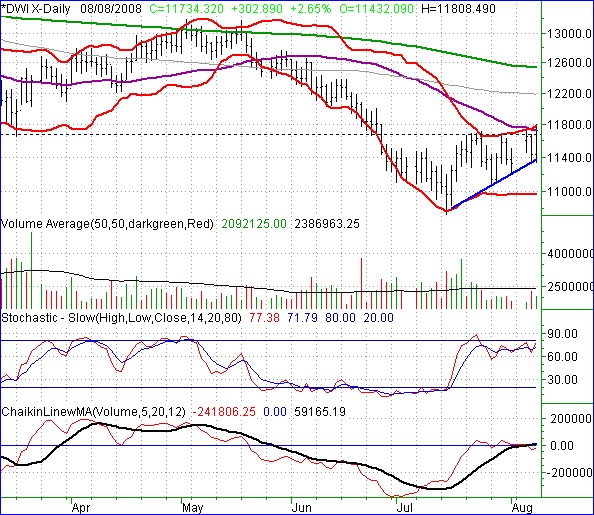
The Dow's 2.65% gain on Friday (+302.89 points) was actually the biggest gain of all the indices. For the week, the 3.60% rally (+408 points) was second best, but still impressive. The Dow closed at 11,734.32, ending the week by struggling with a lot of resistance.
Check out two key items on the chart. The 50-day moving average line (purple), and the upper 20-day Bollinger band (red). Both kept the rally contained on Friday, and to some degree capped Wednesday's effort.
Volume has also been anemic, so if the bulls are going to make this effort into something more, they're going to have to do better.
If they do happen to break past 11,750, a move to the 100-day line (12,200 is possible)m but we'd expect no better than a move to the green 200-day moving average line (12,545), if we even get that far. Notice that the 200-day moving average was where the trouble started back in May. Don't get bearish yet though. There's still a lot of support to fall back on.
Dow Jones Industrial Average Chart - Daily

Price Headley is the founder and chief analyst of BigTrends.com.
|