| A Mid-Week Look At The Market |
| By Price Headley |
Published
08/14/2008
|
Stocks
|
Unrated
|
|
|
|
A Mid-Week Look At The Market
This is your Mid-Week analysis of the major markets from a technical perspective. I'm using the SPY, QQQQ, and DIA ETFs as a proxy for the S&P 500 Index, NASDAQ 100 Index, and the Dow Jones Industrial Average.
S&P 500 Index (SPY)
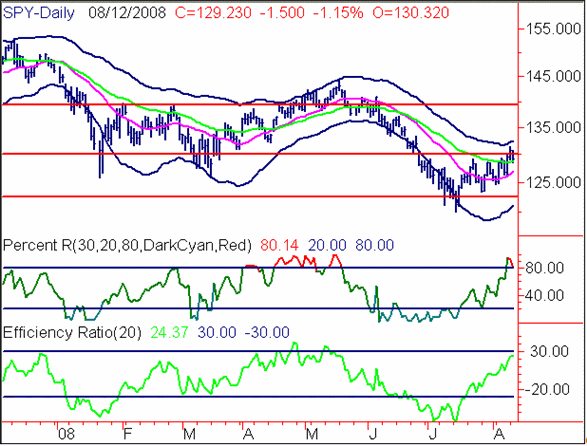
The SPYders have rallied since Mid-July, but seem to be approaching key levels of resistance. The 1300 has been a key technical area several times, and we closed above it two days ago, only to fall back below. The apparent failure at this important round number/strike price/psychological level should lead to a move down to support, possibly at the 1250 level. A break to the Bottom Acceleration Band is possible as well, leading to a 1200 downside target. Further upside should be contained by the Top Acceleration Band, which is currently around 1325. The Percent R and Efficiency Ratio readings on the SPY are currently strong - whether the current Percent R re-test attempt is successful or not will be key to the near-term performance. Bottom line prediction here would be for a pull back to the 1250ish area, followed by another move up to test the Top Band around 1325.
S&P 500 Index Daily Chart

NASDAQ 100 Index (QQQQ)
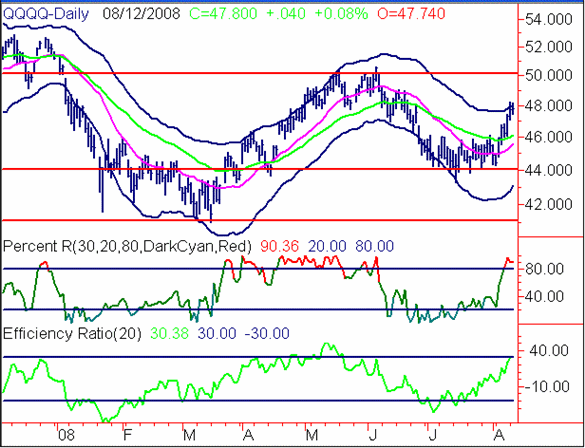
The QQQQs have been stronger in terms of the Acceleration Bands - they have bumped against but closed below the Top Band for the past two trading days. Percent R and Efficiency Ratio are also in crucial positions of strength - we look to be at an inflection point where a breakout to upside or breakdown to support will occur soon. Upside potential should be capped around the key 50 strike level. Downside protection comes around the 45 strike, and beyond that around the 42ish area. This Index has generally been an outperformer vis-a-vis the other major indices over the past couple of months, and is likely to continue to be the strongest of these indices. Notice how the SPY made lower lows in July than the Spring 2008 lows, while the QQQQ landed its lows at a much higher level than its Spring lows - and that 44ish area is now strong support in my view. However, a near-term pullback to the 46/45 area looks to be in the cards over the short-term.
NASDAQ 100 Index Daily Chart

Dow Jones Industrial Average (DIA)
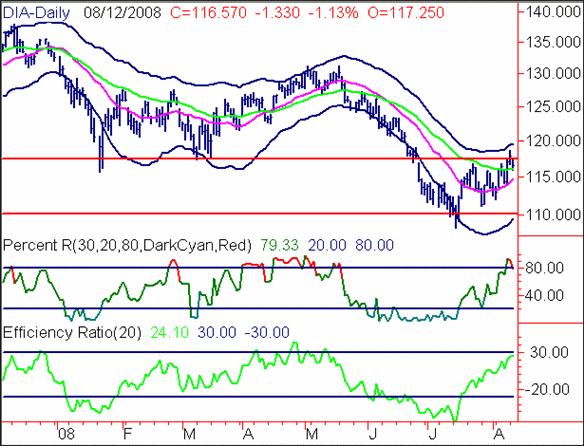
The DIAmonds chart is the weakest of the three indices examined, in my view. Notice how we have rallied back to key resistance around 11,750. This should hold back any further rallies - if it is penetrated, then 12,000 lies above as a key round resistance strike price level, and is also the site of the Top Acceleration Band. 11,500 is a key middle range support level that may become resistance on a failure, with further downside support coming all the way back down around 11,000. Once again, though, Percent R and Efficiency Ratio are strong on all three of these charts - successful re-tests of those indicators could point to a stronger market than I expect currently.
Dow Jones Industrial Average Daily Chart

Price Headley is the founder and chief analyst of BigTrends.com.
|