| The McMillan Options Strategist Weekly |
| By Lawrence G. McMillan |
Published
08/15/2008
|
Options
|
Unrated
|
|
|
|
The McMillan Options Strategist Weekly
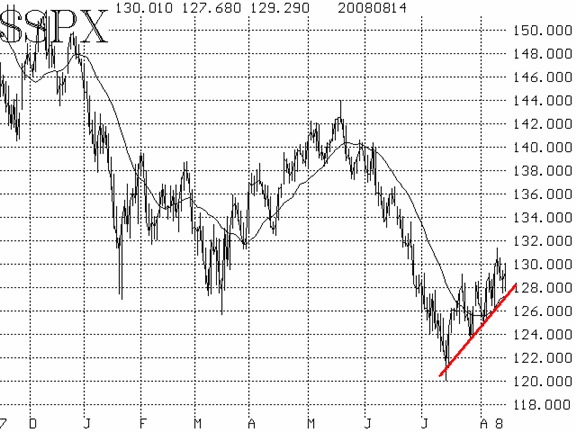
The broad stock market has been able to move higher, albeit in stuttering steps. There has been plenty of day-to-day volatility, with $SPX closing more than 15 points higher or lower on twelve of the last twenty trading days. Despite that, a clear uptrend exists on the $SPX chart (Figure 1) and the 20-day moving average is now rising as well. That moving average and the trend line connecting the three recent lows are at about the same place -- 1270, basis $SPX. Thus, as long as $SPX remains above that line, the $SPX chart will be bullish. While the other indicators are also important, we would not be inclined to act upon sell signals -- should any arise -- while the $SPX chart is bullish.

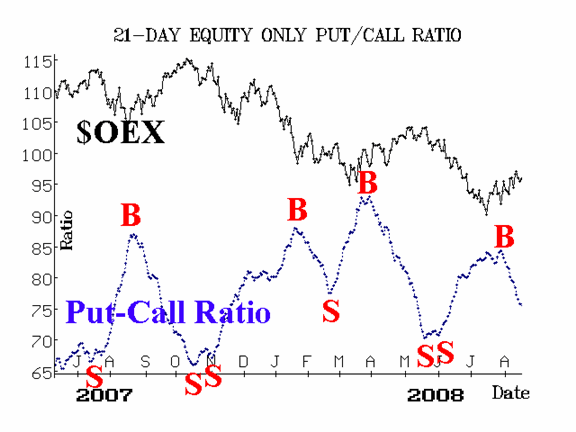
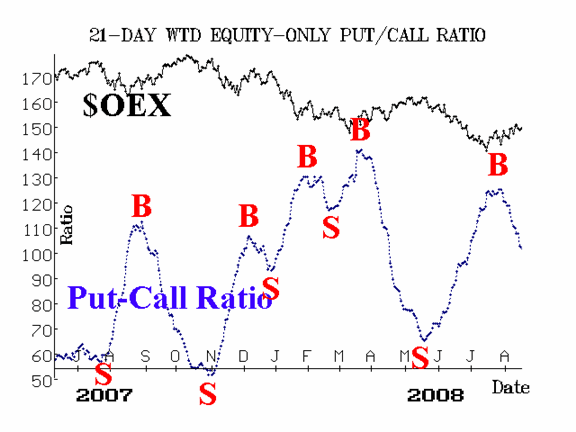
The equity-only put-call ratios remain steadfastly bullish. They are continuing to decline on their charts. As long as they are declining, these charts are bullish. At the present time, they are only about mid- way down their charts, so there seems to plenty of room for the current market rally to continue, while these ratios work their way lower.

Market breadth has not been particularly strong. This is one of the reasons why we don't think the bottom has been seen. If this rally were truly the end of the bear market, breadth should have expanded greatly, driving the oscillators deeply into overbought territory and keeping them there. But breadth didn't expand much at all.

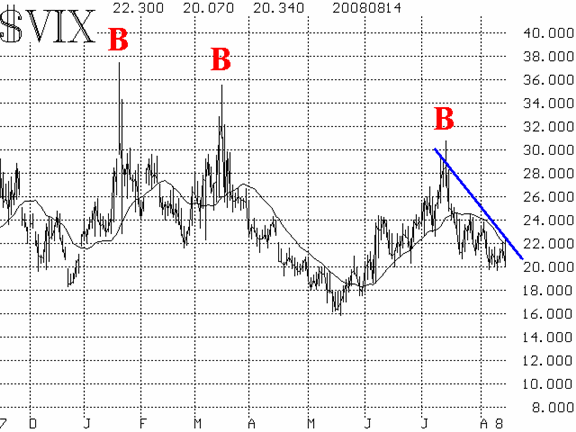
Volatility indices have bounced back and forth somewhat, but are generally working their way lower. A downtrend in $VIX is bullish, so this indicator is positive as well. Recently $VIX has been bounced back and forth between 20 and 22. A close above 22 would be somewhat negative in that it would interrupt the downtrend in $VIX, and it would also be a close above the declining 20-day moving average of $VIX.

In summary, we will remain long SPY and QQQQ positions as long as the uptrends are intact in those indices. The fact that most of the other indicators are positive is strong supporting evidence as well.
Lawrence G. McMillan is the author of two best selling books on options, including Options as a Strategic Investment, recognized as essential resources for any serious option trader's library.
|