| Outlook On The Stock Indices |
| By Price Headley |
Published
08/16/2008
|
Stocks
|
Unrated
|
|
|
|
Outlook On The Stock Indices
We've got our regular short-term chart analysis today, but we wanted to give a special preface this week just to set the tone. It's worth noting there's been a big disparity between large caps and small caps lately. That's generally bullish, albeit in a philosophical way; it may not mean much from a day-to-day perspective. Nonetheless, the NASDAQ and the Russell 2000 have both been outpacing the S&P 500 and the Dow. The downside to that strength? They're both well overbought, and therefore the most vulnerable. We'll be adding the Russell 2000 chart to the mix today to make that key point.
NASDAQ Composite
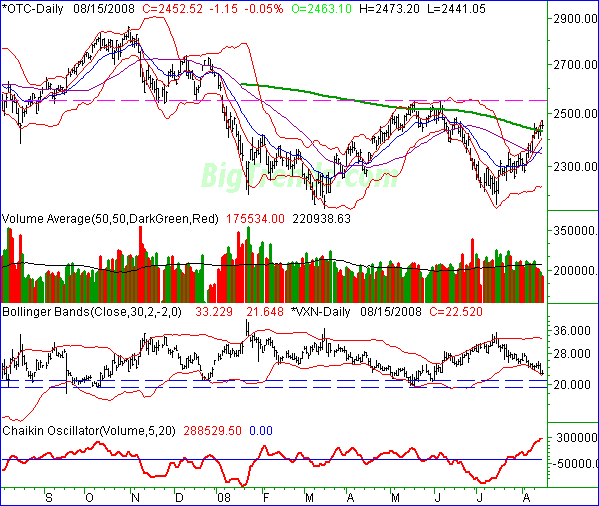
The NASDAQ's 1.15 point loss (-0.05%) on Friday led it to a close of 2452.52. That still meant a 38.42 point (+1.59%) gain for the week though -- the fifth straight weekly gain for the composite.
Along the way we saw the NASDAQ work its way above the 200-day moving average line (green), much more so than it did in June. That would be bullish were it not for on thing: the pace at which it's been gaining may be too strong to sustain.
So, as far as the NASDAQ is concerned, we're not interest in making a call or buying into the chart until we see it ease a little back to the 10- or 20-day average. That will bring it back under the 200-day moving average line though. That will be neither bearish nor bullish, however. We just want to see how the chart behaves when it's not stretched to the limit. Or more specifically, we're interested in seeing how the NASDAQ behaves when it's got a shot at actually falling under support or breaking past resistance.
On the note, the next big resistance line we see is 2550, again. Support is still the 50-day line, currently at 2347. Anything in between, and we're unable to make a call.
By the way, the VXN may be the better tool to use right now, in terms of spotting a reversal point. It's on approach towards two big support lines, one at 20.8, and the other at 19.3 (the VXN closed at 22.52).
NASDAQ Composite Chart - Daily

S&P 500
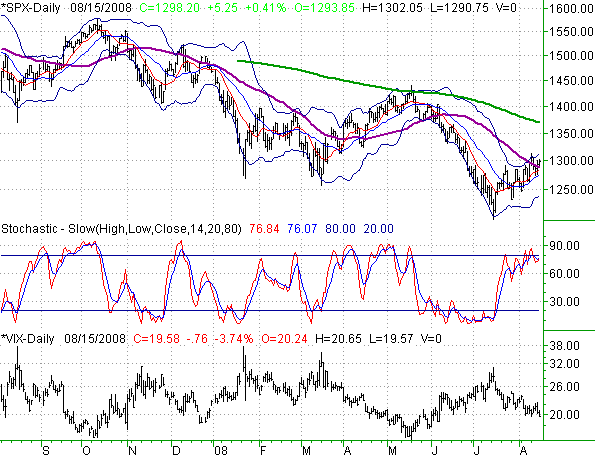
The S&P 500 rallied by 5.25 points on Friday (+0.41%) to close at 1298.20. That translated into a weekly gain of 1.9 points (0.15%).
In a nutshell, we're bullish on the S&P 500 (much more so than we are on the NASDAQ or the Russell 2000). Why? One reason is the cross above the 50-day average (purple). We know it's stupidly simple, but it works. We could even tolerate a temporary move back to the 20-day line (blue) at 1273 and still stay bullish, as long as the 20-day line holds up as support.
Our bullishness only extends up to 1369 though, where the 200-day line currently resides. The VIX is apt to find support around that time anyway, if the SPX makes a run for it.
S&P 500 Chart - Daily

Dow Jones Industrials
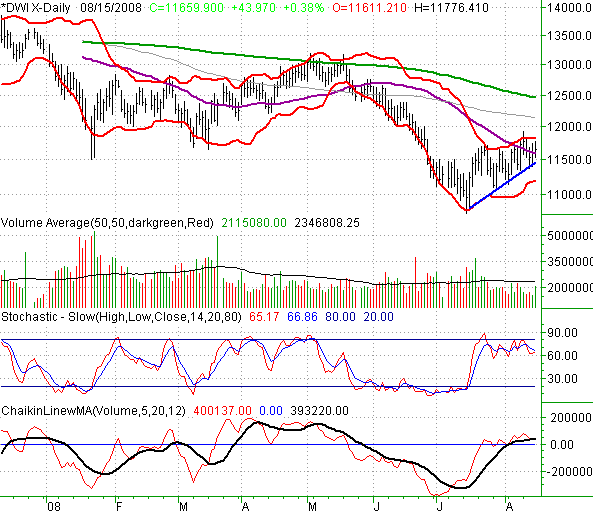
The Dow gave us 43.97 points on Friday, gaining 0.38% to end up at 11,659.9. That was still 74.42 points below (-0.63%) the previous week's close, and also the only index that lost ground last week. Like we said, there's a pretty clear disparity between large and small caps right now.
We'll be short and sweet on the Dow today, since we've added some extra thoughts this time around. Technically, the chart's bullish. The Dow's finding short-term support (thick, blue), and has crossed above its 50-day line (purple) as well. The effort has been slow though, possibly because there's been dwindling volume the whole uptrend. We think the Dow offers the least movement potential (in percentage terms), whether it be bullish or bearish.
Dow Jones Industrials Chart - Daily

Russell 2000
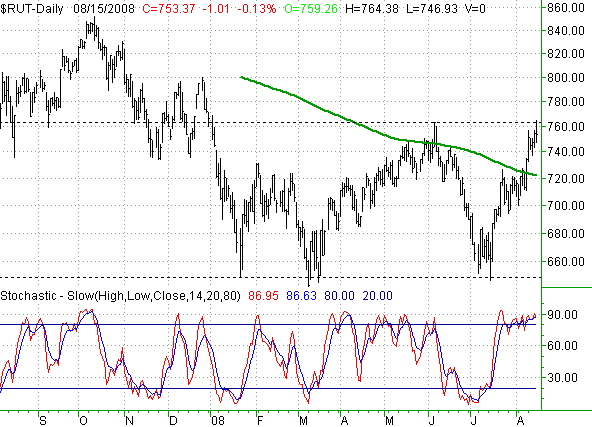
So what's the deal with the Russell 2000? It's also well above its 200-day moving average line. The problem is, it's stochastically overbought too. That doesn't necessarily have to be a problem if it weren't for one thing: the Russell 2000's rally was also stopped cold at a previous significant peak.
Friday's peak of 764.38 basically matched June's high of 763.27 (dashed). After observing this second encounter with resistance and a third encounter with support at 650, you could make a good argument that the index is on a trading range. If it is, we'll know soon enough, possibly Monday. More importantly, if it is range-bound, the index is likely headed south.
Russell 2000 Chart - Daily

Price Headley is the founder and chief analyst of BigTrends.com.
|