| Corcoran Technical Trading Patterns For August 18 |
| By Clive Corcoran |
Published
08/18/2008
|
Stocks
|
Unrated
|
|
|
|
Corcoran Technical Trading Patterns For August 18
Sometimes financial markets are relatively easier to trade than at other times as trends and inter-market strategies become quite transparent. Since it became apparent that the commodity "bubble" was starting to deflate in mid-July and after the ECB confirmed in its early August statement the market's own interpretation that the Euro was topping out and that a major dollar rally was getting under way, the direction of many asset classes, especially the currencies and crude, has been quite predictable.
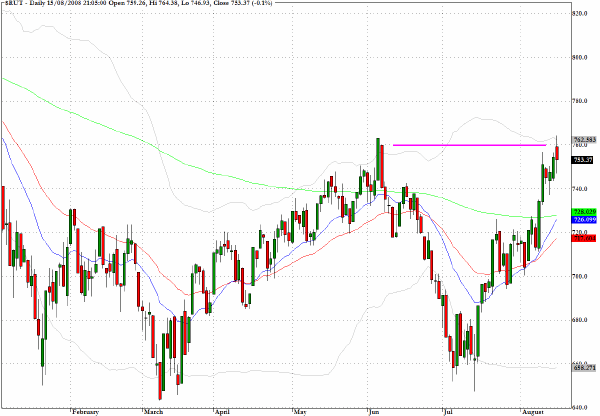
The situation with US equities has been less easy to discern but the Russell 2000 (^RUT) has continued to reward on the long side. In Friday's trading the index has returned to the early June high and it would not be surprising to see some consolidation on this index near current levels.
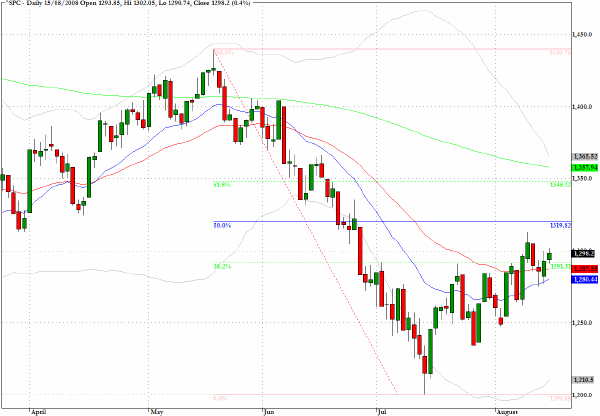
The S&P 500 (^SPC) has almost attained the 1320 level which represents the 50% retracement of the high from mid-May and the low from early July. Looking further out towards the 1350 level, the bullish momentum will need to gather some pace to take out the 62% retracement level.
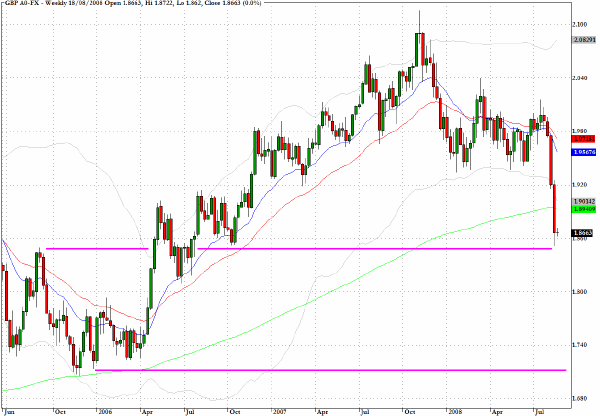
One of the best recent trades has been on the short side for sterling as discussed here several times in the last few weeks. The $1.85 level shows chart support but longer term, as revealed on the weekly chart, it would not be surprising to see the British currency heading towards the $1.70 level.
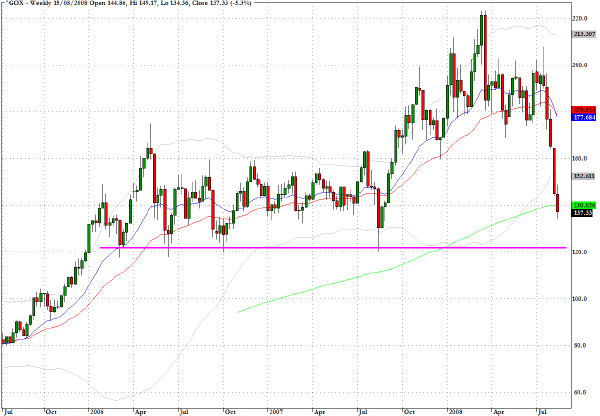
The price of gold has been dropping rapidly in tandem with the strong showing of the US dollar. The chart below suggests that the CBOE Gold Index (^GOX) could be setting up for a testing of the 120 level which suggests further downside potential for both the metal itself and the gold mining stocks.
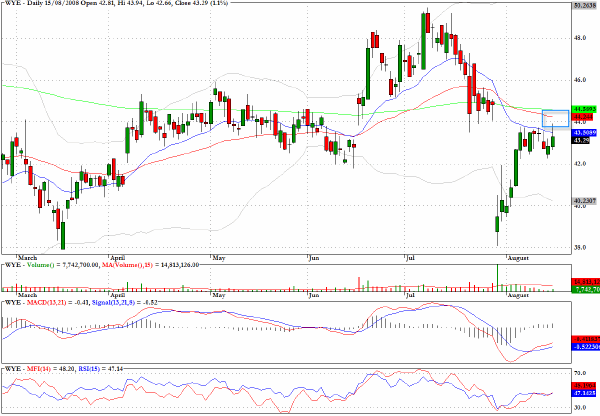
The recovery in Wyeth (WYE) appears to be running into resistance.
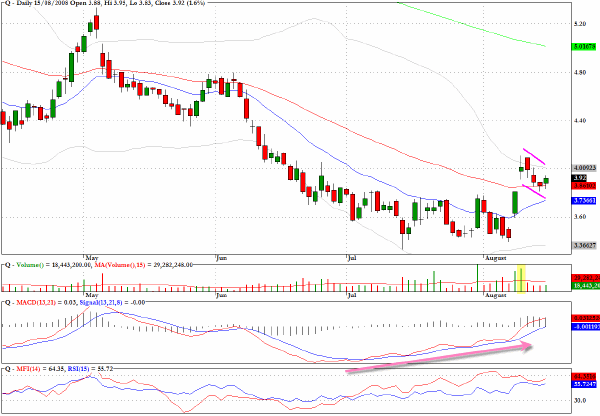
Qwest Communications (Q) shows intermediate-term positive MACD divergences and a bullish short term flag pattern.
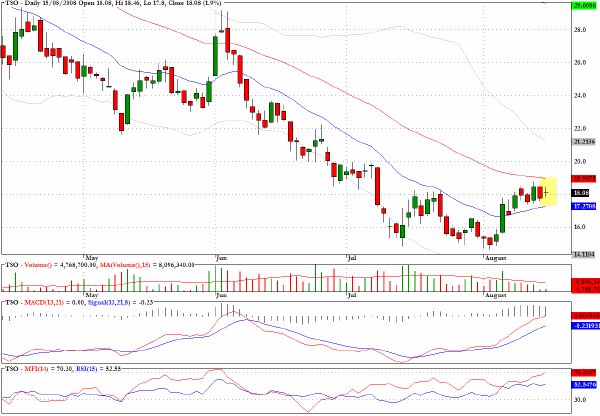
Tesoro (TSO) appears to be in an intermediate term basing pattern but the near term direction is less clear, although Friday's tiny doji/NR7 pattern is often seen ahead of a decisive move.
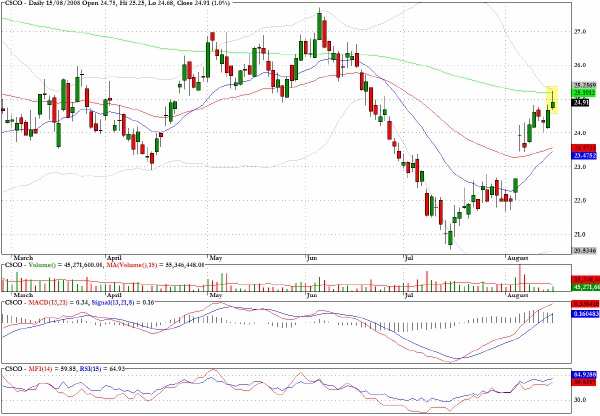
Friday's action for Cisco Systems (CSCO) shows a shooting star pattern exactly at the 200-day EMA level.
Clive Corcoran is the publisher of TradeWithForm.com, which provides daily analysis and commentary on the US stock market. He specializes in market neutral investing and and is currently working on a book about the benefits of trading with long/short strategies, which is scheduled for publication later this year.
Disclaimer
The purpose of this article is to offer you the chance to review the trading methodology, risk reduction strategies and portfolio construction techniques described at tradewithform.com. There is no guarantee that the trading strategies advocated will be profitable. Moreover, there is a risk that following these strategies will lead to loss of capital. Past results are no guarantee of future results. Trading stocks and CFD's can yield large rewards, but also has large potential risks. Trading with leverage can be especially risky. You should be fully aware of the risks of trading in the capital markets. You are strongly advised not to trade with capital.
|