| Corcoran Technical Trading Patterns For August 26 |
| By Clive Corcoran |
Published
08/26/2008
|
Stocks
|
Unrated
|
|
|
|
Corcoran Technical Trading Patterns For August 26
For those of a bullish persuasion there may be some comfort to be drawn from the fact that yesterday's rather sharp sell-off in the US market was accompanied by the unsurprisingly light volume of the last Monday in August.
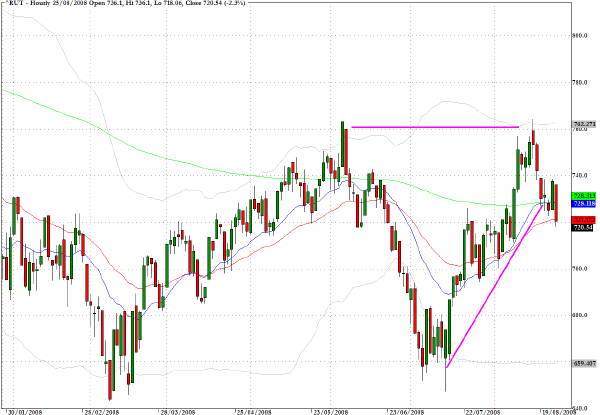
The Russell 2000 (^RUT) produced exactly the testing of the 720 level that I discussed last week and fell relatively further than other broad indices.
This index now confronts a potential break of the upward slanting trendline since mid July and is also confined above by the potential double top pattern. As we move into September the conviction of those who have been steadily accumulating in the small cap sector since March will continue to be tested by the erratic outlook for the financial sector. Unless the Russell 2000 provides clear evidence of a breakdown in coming sessions I would remain moderately positive about US equities in the near term but want to re-evaluate that outlook if and when this index tries to rally back above 760.
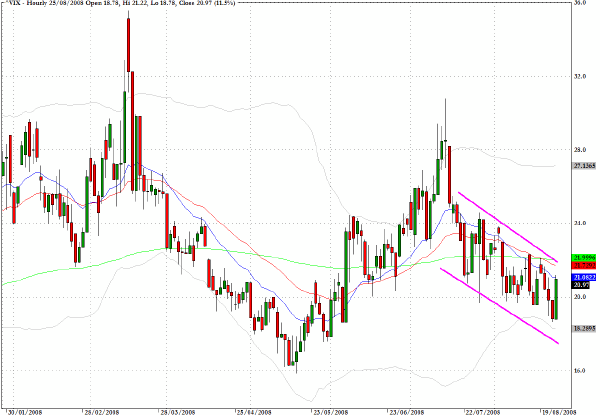
The CBOE Volatility Index (^VIX) remains within a downward channel since the mid-July low but a clear break above the 22 level, at which the moving averages intersect, would suggest that institutional managers are still not convinced that the worst of the financial mess has been seen.
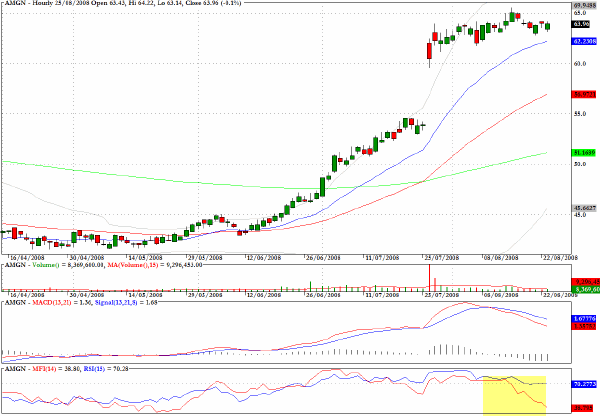
Amgen (AMGN) appears to be defying gravity at current levels.
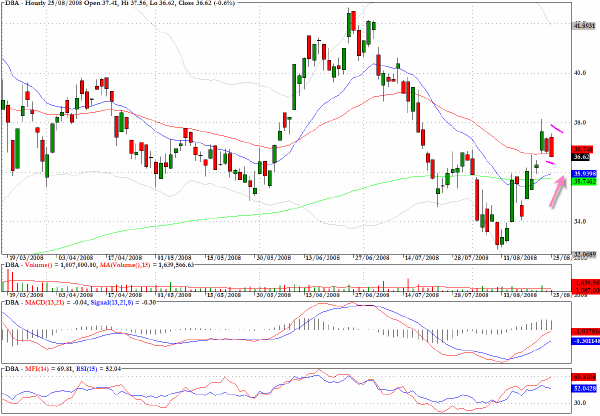
The exchange traded fund, DBA, allows participation on the long side in various agricultural futures contracts and the recent chart action shows that, despite a temporary break below the 200-day EMA, there appear to be more constructive chart dynamics emerging.
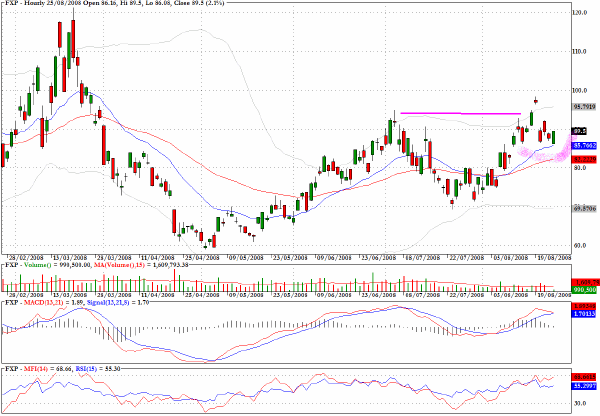
FXP is an inverse leverage fund that would profit from further weakness in the Chinese market. Some recent analysis of applying standard technical pattern analysis to these Ultra Short funds suggests that one has to be relatively cautious in following signals that are reasonably reliable with long sector funds to inverse funds.
In addition, the leverage of two-to-one would keep me on the sidelines at present but a break above the recent high just below 100 would suggest that the highs seen in March could be back in play.
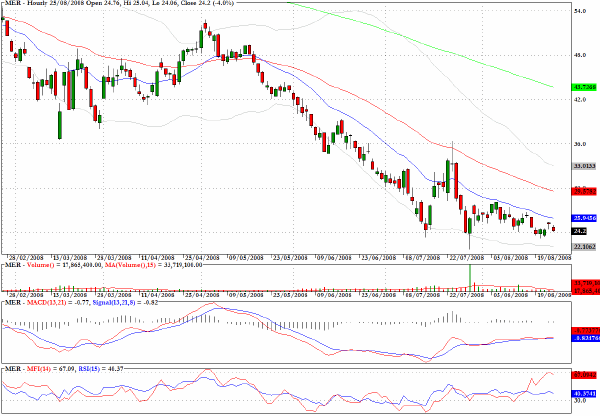
From a technical perspective Merrill Lynch (MER) is in a basing pattern and there is some evidence of accumulation with positive MFI divergences.
Clive Corcoran is the publisher of TradeWithForm.com, which provides daily analysis and commentary on the US stock market. He specializes in market neutral investing and and is currently working on a book about the benefits of trading with long/short strategies, which is scheduled for publication later this year.
Disclaimer
The purpose of this article is to offer you the chance to review the trading methodology, risk reduction strategies and portfolio construction techniques described at tradewithform.com. There is no guarantee that the trading strategies advocated will be profitable. Moreover, there is a risk that following these strategies will lead to loss of capital. Past results are no guarantee of future results. Trading stocks and CFD's can yield large rewards, but also has large potential risks. Trading with leverage can be especially risky. You should be fully aware of the risks of trading in the capital markets. You are strongly advised not to trade with capital.
|