| Bearish Technicals For Nasdaq |
| By Mike Paulenoff |
Published
08/26/2008
|
Stocks
|
Unrated
|
|
|
|
Bearish Technicals For Nasdaq
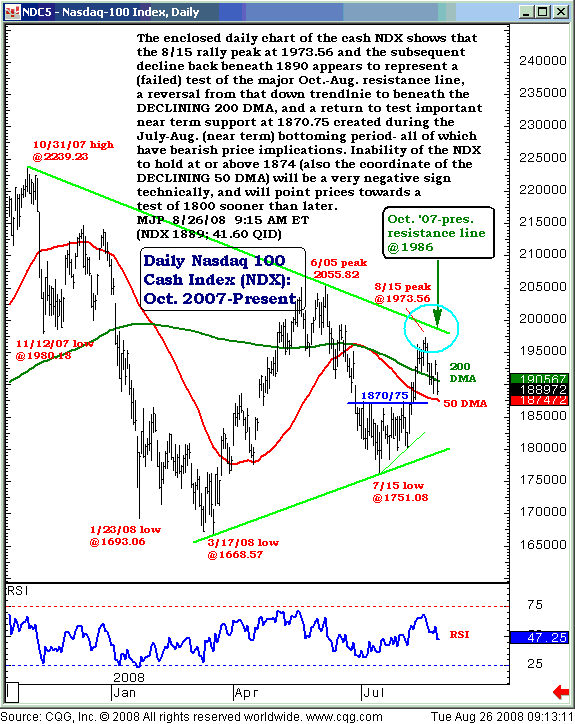
The enclosed daily chart of the cash NDX shows that the August 15 rally peak at 1973.56 and the subsequent decline back beneath 1890 appears to represent a failed test of the major October-August resistance line, a reversal from that down trendline to beneath the declining 200-day moving average , and a return to test important near-term support at 1870.75 created during the July-August near-term bottoming period. All of this has bearish price implications for the NDX and holders of the QQQQ ETF. Inability of the NDX to hold at or above 1874 (also the coordinate of the declining 50-day moving average) will be a very negative sign technically and will point prices towards a test of 1800 sooner or later.
Mike Paulenoff is a 26-year veteran of the financial markets and author of MPTrader.com, a real-time diary of his technical chart analysis and trading alerts on all major markets. For more of Mike Paulenoff, sign up for a free 15-Day trial to his MPTrader Diary by clicking here.
|


 Free Festival of Traders Videos