| Corcoran Technical Trading Patterns For August 28 |
| By Clive Corcoran |
Published
08/28/2008
|
Stocks
|
Unrated
|
|
|
|
Corcoran Technical Trading Patterns For August 28
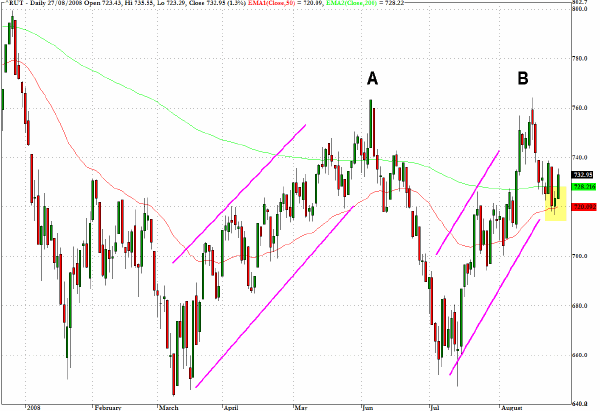
The Russell 2000 (^RUT) has performed pretty much in line with my expectations recently as a retreat to the pivotal 720 level seems to have resolved itself in favor of another move back to 760.
There are some clear parallels between the two rally failures that culminated in points A and B. Having retreated to, and tested quite convincingly the 720 level in Monday's session, there is now evidence that the parallel patterns are deviating as the index appears to have reversed quite abruptly and be headed towards a re-test of the level seen at point B.
If, as seems very likely, the 50-day EMA moves above the 200-day EMA on this re-test and if the break is not a fake move on light volume, this would be a very encouraging development for the bulls.
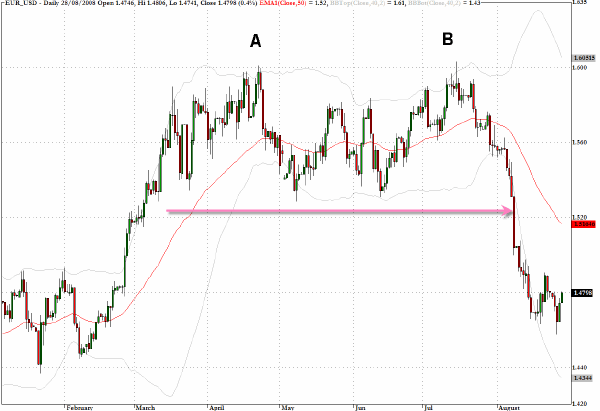
The euro is consolidating at previous chart support levels near $1.47 and there may be some follow-through recovery, as some pundits are suggesting that comments by two ECB governors about the need to keep a tightening bias on short term rates in the euro-zone should be taken seriously. The economic prospects for many of the major European economies are fading fast and I would be surprised to see the euro make it any further than $1.52/1.53.
The UK economy, which is not part of the euro-zone, is fading even more seriously than many of its continental partners and this suggests further weakening of sterling in the cross rate with the euro.
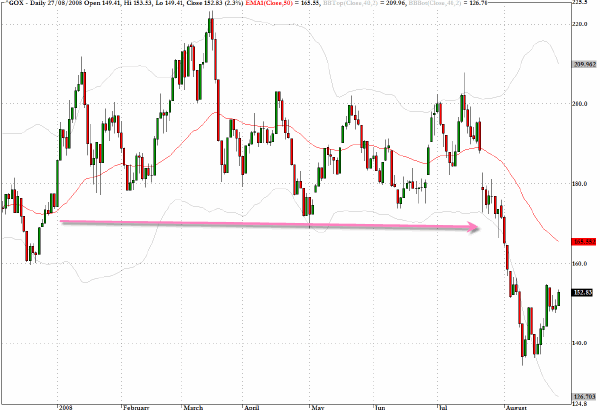
The chart for the Gold mining stocks (GOX)has some similarities with the chart for the euro and in line with my views on the currency I would see the 170 level as a key hurdle for this index.
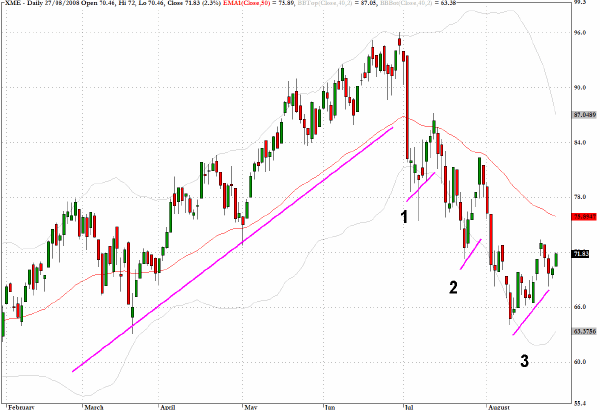
The SPDR Metals and Mining sector fund, XME, has been moving downwards in a staircase fashion since the critical trend line break in early July, and leg 3 of the bearish pattern could soon be reaching another inflection point.
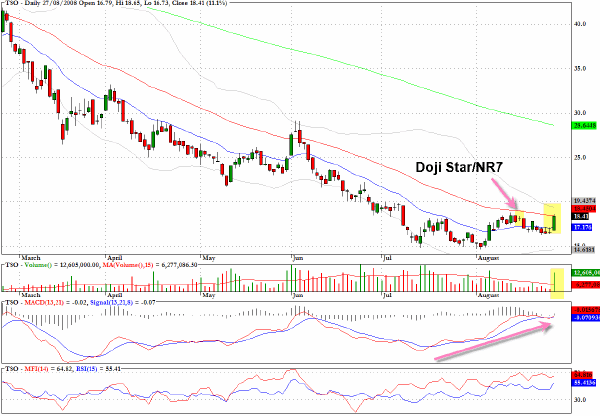
Sometimes chart patterns produce signals that take some time to deliver on their promise. Ten days ago I noted that Tesoro (TSO) had registered a tiny doji/NR7 pattern which is often seen ahead of a decisive move. The stock had meandered for several sessions but in yesterday's trading there was an eleven percent up move on very substantial volume confirming the positive divergences on the MACD chart.
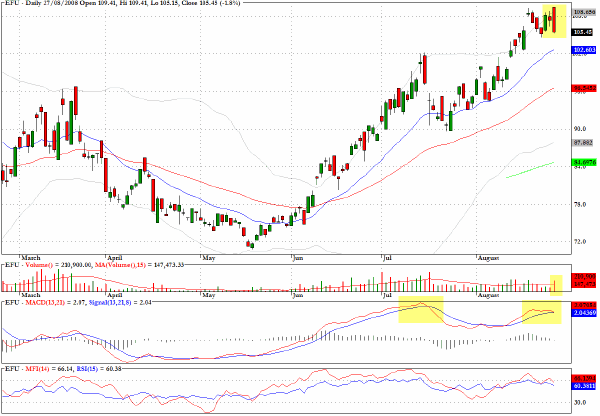
The Ultra Short ETF's pose certain challenges for chart analysis as the normal symmetry that would allow one to transfer inverse patterns that are applicable on the long side can be error prone. I feel a little more confident that the chart below for the Ultra Short fund for the MSCI EAFE index, EFU, is pointing to a fairly clear case of a negative divergence at a top. Moreover this prognosis appears to be in harmony with the interpretation that one would give to EFA which is the long version of the same index (although the long fund does not include the 2:1 leverage of the short version).
Clive Corcoran is the publisher of TradeWithForm.com, which provides daily analysis and commentary on the US stock market. He specializes in market neutral investing and and is currently working on a book about the benefits of trading with long/short strategies, which is scheduled for publication later this year.
Disclaimer
The purpose of this article is to offer you the chance to review the trading methodology, risk reduction strategies and portfolio construction techniques described at tradewithform.com. There is no guarantee that the trading strategies advocated will be profitable. Moreover, there is a risk that following these strategies will lead to loss of capital. Past results are no guarantee of future results. Trading stocks and CFD's can yield large rewards, but also has large potential risks. Trading with leverage can be especially risky. You should be fully aware of the risks of trading in the capital markets. You are strongly advised not to trade with capital.
|