| Corcoran Technical Trading Patterns For September 3 |
| By Clive Corcoran |
Published
09/3/2008
|
Stocks
|
Unrated
|
|
|
|
Corcoran Technical Trading Patterns For September 3
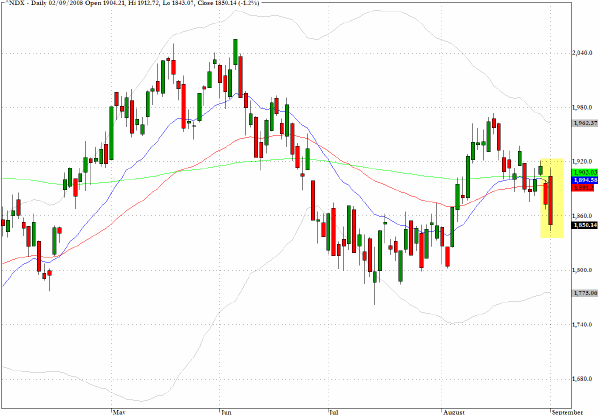
The concern that I touched on yesterday regarding the technology sector and the technical condition of the Nasdaq 100 (^NDX) found further expression in yesterday's trading.
It is always good to be wary of "violations" of trend line support when volumes are not substantial (although volume on QQQQ did pick up during yesterday's session). Adding further support to the idea that a re-thinking is taking place amongst fund managers about the outlook for the sector, based on perhaps over generous price/earnings multiples and valuations, was the price reversal that took place during the day following the earlier bout of post Labor Day enthusiasm.
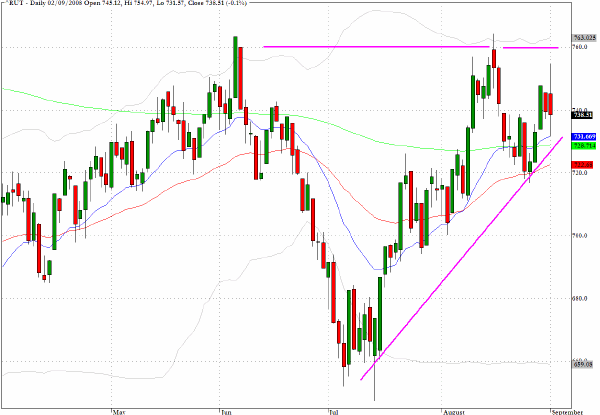
The Russell 2000 (^RUT) spiked up intraday to 755 yesterday and closed with a rather striking candlestick formation. An inside day on Friday followed by a whipsaw spinning top yesterday near to a significant high is a pattern that will make me especially vigilant with the small cap index in coming sessions for seeking out short term clues as to overall equity market direction.
Commodities dropped across the board yesterday and there were some significant shifts across sectors suggesting that asset allocation strategists are beginning to place their inter-market chips on the table.
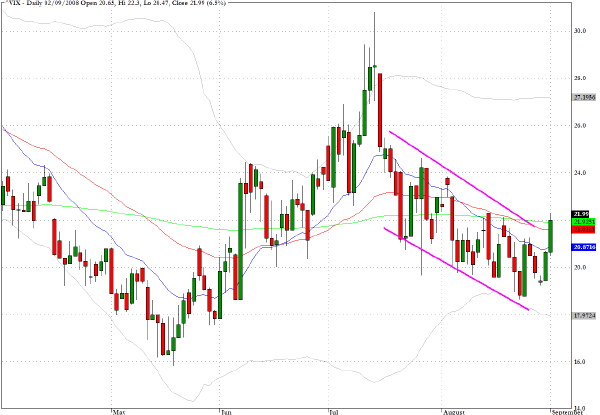
One chart that I shall be watching closely is for the CBOE Volatility Index (^VIX) which is now challenging the upper trend-line which tracks a recent decline in the market's anticipation of future volatility. If we see continued weakness in the tech sector, a failure by the Russell 2000 to take on the 760 level, and a break through the VIX channel at the 200-day EMA indicated on the chart below, this would move me away from my intermediate term positive bias.
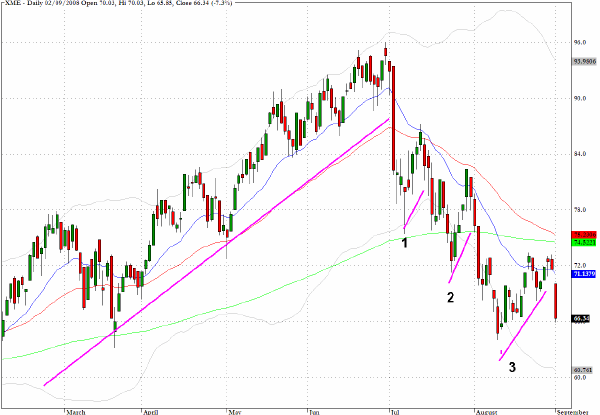
Last week I discussed the metals and mining sector in this commentary as well as during an inteview on CNBC last Thursday and suggested that we were on the verge of completing a third step in a downward staircase pattern.
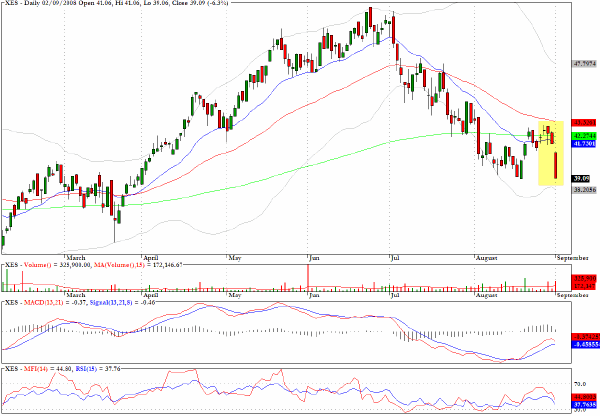
Yesterday's action produced the anticipated price rejection very near to the intersection of key moving averages and would have yielded a 7% plus return on the short side.
Many charts for energy-related sector funds are breaking below key levels.
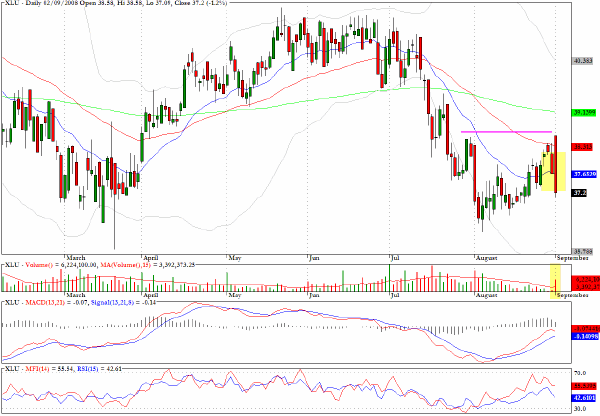
Often the price behavior of the utilities tracks moves in the long-term Treasury market, and we are beginning to see divergences as yields on 10-year notes are falling but the pattern for the utility sector is looking weak.
Many asset allocators appear to be seriously grasping the threat to consumer-related stocks as daily evidence of the global slowdown appears in a slew of government and analyst's reports.
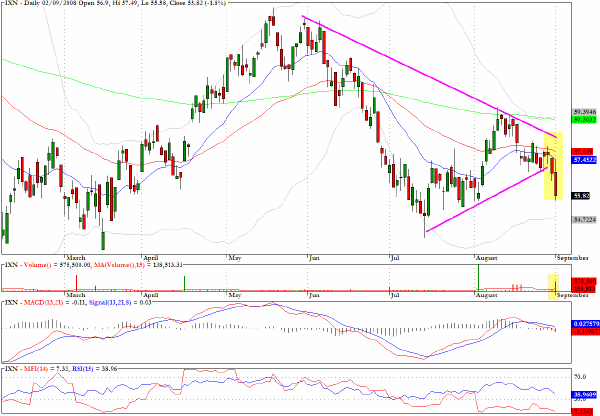
IXN, which comprises stocks from global technology, is exhibiting corrective patterns that could suggest a return to levels seen in July and previously in March.
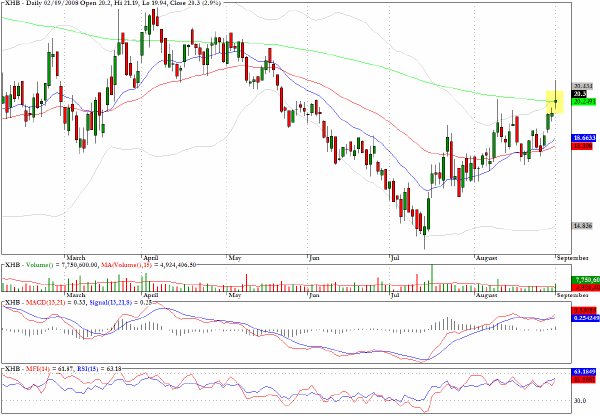
In a day of erratic market moves and whipsaws, characterized by the large number of spinning top/star formations, the sector fund for homebuilders, XHB, suggests that a possible rally top may have been seen at the 200-day EMA.
Clive Corcoran is the publisher of TradeWithForm.com, which provides daily analysis and commentary on the US stock market. He specializes in market neutral investing and and is currently working on a book about the benefits of trading with long/short strategies, which is scheduled for publication later this year.
Disclaimer
The purpose of this article is to offer you the chance to review the trading methodology, risk reduction strategies and portfolio construction techniques described at tradewithform.com. There is no guarantee that the trading strategies advocated will be profitable. Moreover, there is a risk that following these strategies will lead to loss of capital. Past results are no guarantee of future results. Trading stocks and CFD's can yield large rewards, but also has large potential risks. Trading with leverage can be especially risky. You should be fully aware of the risks of trading in the capital markets. You are strongly advised not to trade with capital.
|