| The McMillan Options Strategist Weekly |
| By Lawrence G. McMillan |
Published
09/5/2008
|
Options
|
Unrated
|
|
|
|
The McMillan Options Strategist Weekly
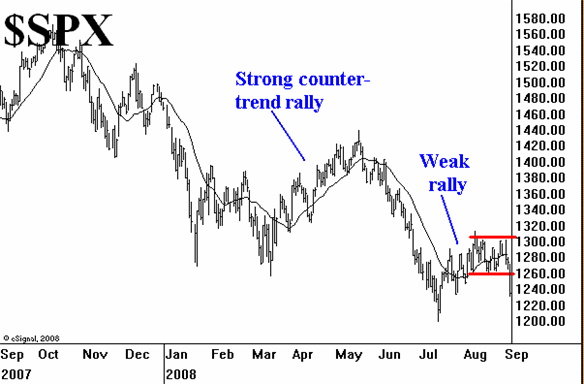
The broad market trading range has finally been broken -- on the downside. $SPX has oscillated between 1265 and 1305 for nearly a month. Now that it has broken through on the downside, we want to see the technical indicators confirm the bearish action. If they do, we'd expect to see a retest of the July lows (which are not that far away). In fact, considering just how oversold the market was at the July bottom, the ensuing rally has been pathetic. Many indicators, some of which were trumpeted far and wide in the media, registered historically oversold conditions in July. Yet all that the bulls could muster was an obviously weak-looking rally (see Figure 1).

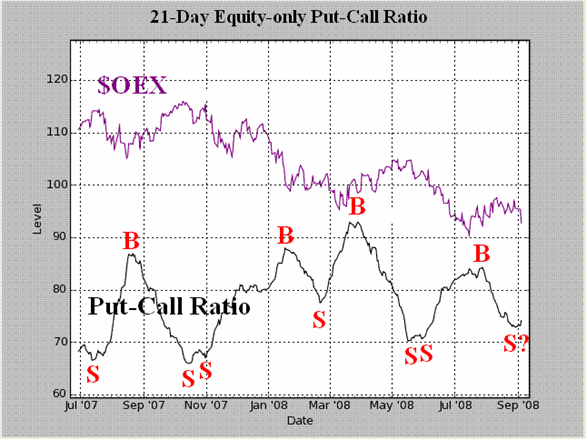
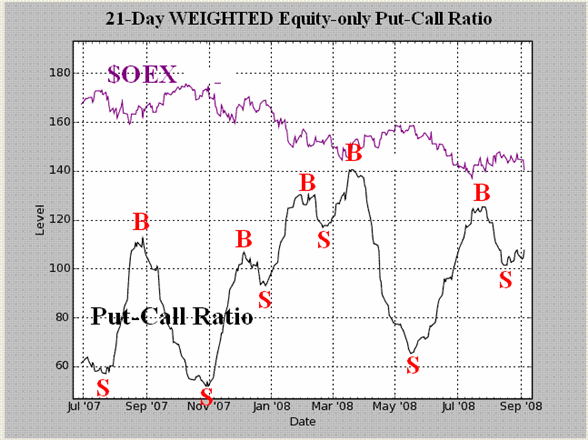
The equity-only put-call ratios are still in disagreement. The standard ratio (Figure 2) has remained on a buy signal since the July bottom, but now it is beginning to curl higher, a move which would result in a sell signal if completed. The weighted ratio rolled over to a sell signal about two weeks ago. It has wavered recently, and needs to clearly exceed the recent high to remain on a sell signal (see Figure 3). But, for now, our computer analysis program rates the weighted ratio as a "sell."

Market breadth generated sell signals after the last rally attempt above 1300 on $SPX. At that time (late last week), breadth expanded enough to get overbought. That's okay as long as it stays overbought. But it did not, and breadth sell signals were issued this week.

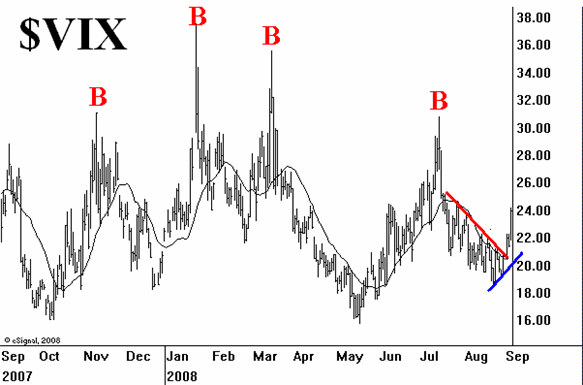
The volatility indices ($VIX and $VXO) broke bullish trend lines this week. When $VIX closed above 21.50 this past Tuesday, that broke the bullish downtrend line. Since then it has accelerated higher, confirming the new bearish uptrend in $VIX. As is often the case when a downturn begins, $VXO is racing ahead faster.

In summary, then, the breakdown by $SPX is significantly bearish. Market breadth oscillators and $VIX have confirmed this move, as they are bearish as well. It also looks like the put-call ratios are falling in line on the bearish side as well. In our opinion, this is a full-fledged sell signal which will test the July lows and likely has a good chance of exceeding them.
Lawrence G. McMillan is the author of two best selling books on options, including Options as a Strategic Investment, recognized as essential resources for any serious option trader's library.
|