| Corcoran Technical Trading Patterns For September 9 |
| By Clive Corcoran |
Published
09/9/2008
|
Stocks
|
Unrated
|
|
|
|
Corcoran Technical Trading Patterns For September 9
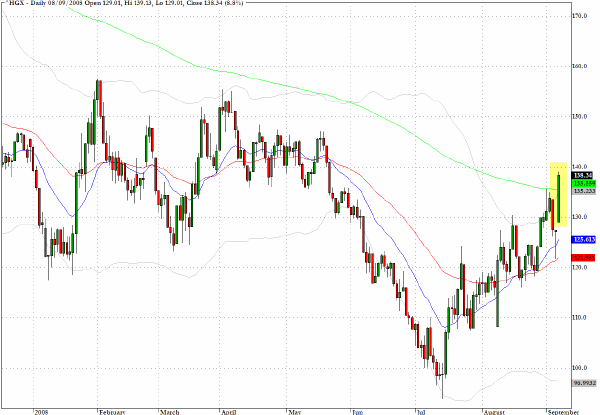
The PHLX Housing Sector index (^HGX) pushed above a critical chart level yesterday and this index needs to be monitored closely in coming sessions for further validation of the move. If we get further confirmation of the break above the 200 day EMA, this would suggest that the market believes that the worst of the real estate woes have been seen.
There are countless opinions about how much further down real estate prices could go, what will happen with all the upcoming mortgage resets, the fallout from the huge unsold inventory being constantly supplemented by ongoing foreclosures etc. but I would suggest keeping this index on your screen for the best evidence of whether the worst case scenarios were already priced in during early July.
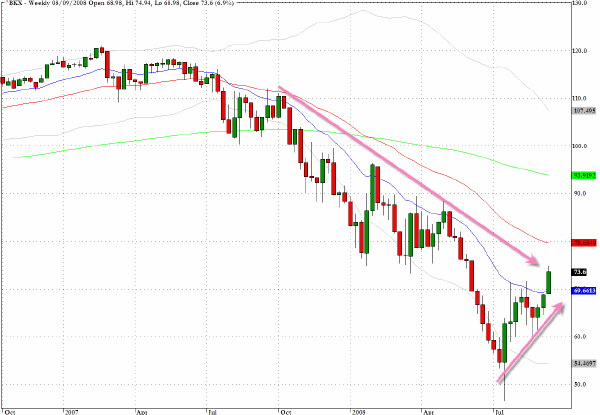
The weekly chart for the KBW Banking index (^BKX) is now challenging a critical downward trend-line through the highs over the past year.
If we see a decisive break upwards and follow through in this sector, this will provide the answer, at least in the medium term, of the decision the capital markets have made as to the efficacy of the nationalization of Fannie and Freddie.
Let's hope that Mr. Paulson, and his successor, have more rabbits in the hat for the next time one is required.
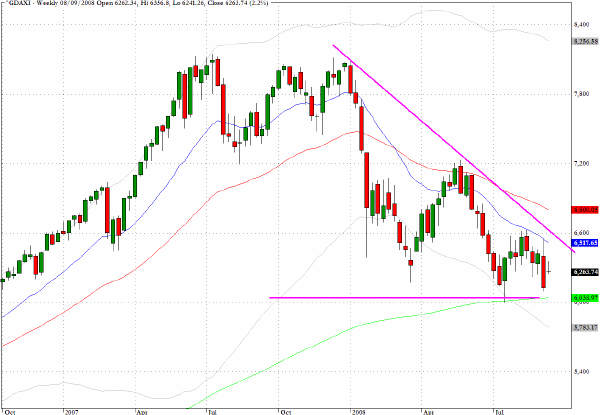
The weekly chart of Germany’s DAX looks unsettling as a rather extended bearish wedge pattern is evolving that could have further to run but which suggests that the eventual resolution, perhaps later this year, favors a sizable down leg.
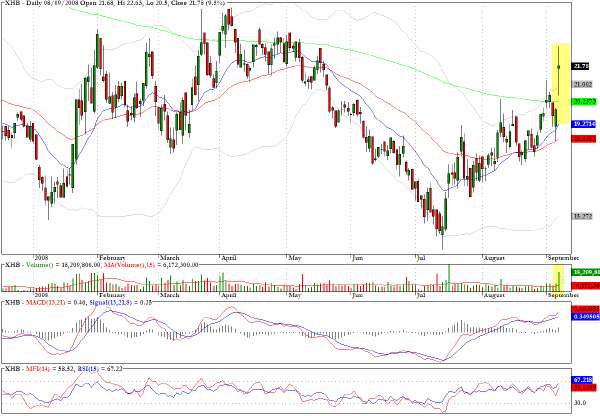
The exchange traded fund for US homebuilders, XHB, registered a very striking doji star formation yesterday. As already intimated in discussion of the Housing Index the chart below suggests we are at a major inflection point where traders are now being required to reveal their best guess as to whether Secretary Paulson's dramatic moves have set in motion the way to avoid massive real estate deflation.
It is precisely the threat of a vicious downward spiral in US property prices which is what is really spooking those strategic sources of dollar liquidity that are being asked to have faith that this crisis, like others, will pass soon.
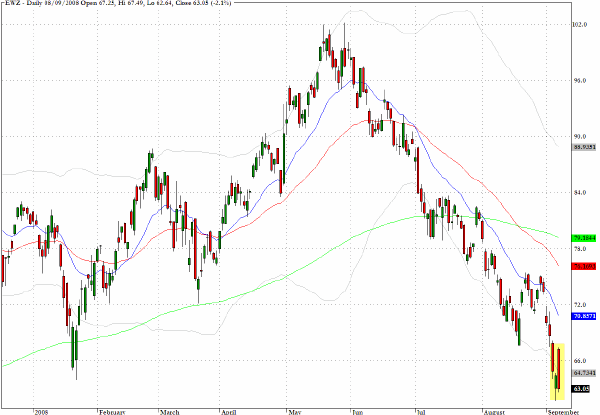
The exchange traded sector fund for the MSCI Brazil Index, EWZ, reveals a rather striking reversal pattern which can best be described as a down trend day within the context of a bullish day for most global equity indices.
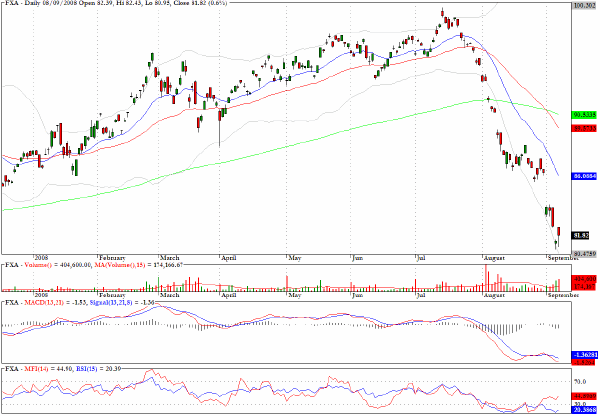
The Australian dollar has lost almost twenty percent against the dollar since mid July but the 80 cent level, flagged in a number of commentaries in early August, should provide a support level. There is some evidence on the exchange traded fund FXA that money flow is pointing to a medium term recovery pattern
Clive Corcoran is the publisher of TradeWithForm.com, which provides daily analysis and commentary on the US stock market. He specializes in market neutral investing and and is currently working on a book about the benefits of trading with long/short strategies, which is scheduled for publication later this year.
Disclaimer
The purpose of this article is to offer you the chance to review the trading methodology, risk reduction strategies and portfolio construction techniques described at tradewithform.com. There is no guarantee that the trading strategies advocated will be profitable. Moreover, there is a risk that following these strategies will lead to loss of capital. Past results are no guarantee of future results. Trading stocks and CFD's can yield large rewards, but also has large potential risks. Trading with leverage can be especially risky. You should be fully aware of the risks of trading in the capital markets. You are strongly advised not to trade with capital.
|