| Corcoran Technical Trading Patterns For September 10 |
| By Clive Corcoran |
Published
09/10/2008
|
Stocks
|
Unrated
|
|
|
|
Corcoran Technical Trading Patterns For September 10
There are some extremely ugly charts across a whole spectrum of asset classes at the moment. I was spoiled for choice in trying to pick the lead item for today's letter as so many charts are at key levels, and highlight the fact that the risk and fear in the market is entering a new critical phase.
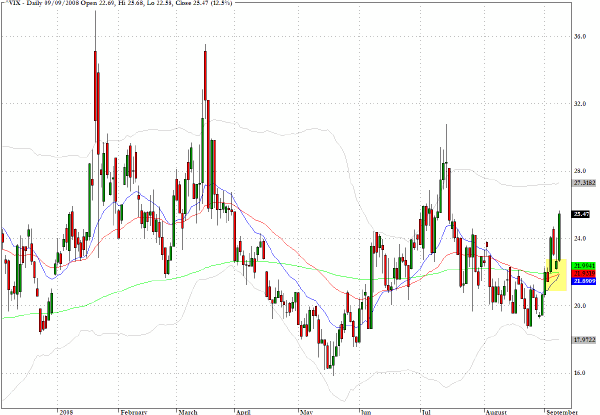
The chart below for the VIX captures the mood of the last few sessions well. We have now broken above the downward channel that I mentioned a week ago and this has caused me to ease up on the opening of new positions and tilted my balance towards the short side again.
The VIX appears to be pushing back towards a possible challenge of the mid-July levels and both moving averages are moving up as the 50-day crosses the 200-day EAM.
The plight of the tech stocks, the bearish performance of almost all of the geographical sector funds, and weakness in anything commodity-related all suggest that we are heading for a new leg down. However, the financials are not rolling over, notwithstanding the partial collapse of Leman's stock in yesterday's session. The news about the talks with Korean banks seemed a bit insubstantial when first announced, and it is rather surprising that the market reacted so dramatically when it became known that negotiations had come unstuck. The fact that the company has brought forward its forward-looking statement to this morning (New York time) suggests that we may get another catharsis moment for the financials in today's trading. I would suggest watching the VIX closely today and cross checking with action in the financials, especially the sector fund XLF for evidence as to whether traders are looking to cover short positions again and send another message that the worst case scenarios have already been previously discounted. A failure to rally across the banking sector and another dive for Lehman specifically would be a distinct negative.
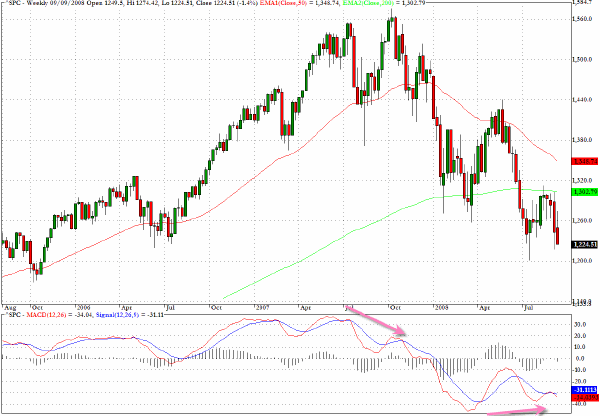
The S&P 500 (^SPX) more than erased Monday's gains with a 3.4% decline, bringing the cash index back towards a probable re-test of the July 15 level.
I have shown before the weekly MACD chart which clearly reveals the negative divergences that preceded last October's new price high, but the evidence on the right hand side of the MACD chart is suggesting that we are not making a new momentum low despite recent bearish price action.
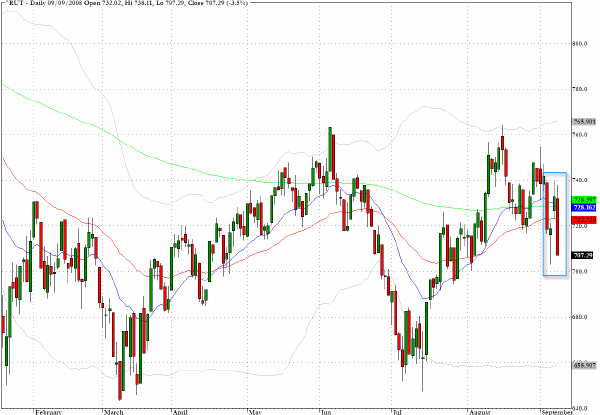
The chart for the Russell 2000 (^RUT) is changing its complexion. The failure to reach back towards 760 and three closes below the 720 level in the last week is suggesting that the previous enthusiasm from fund managers for small caps is waning.
The box drawn on the chart shows that despite yesterday's large red candlestick, and 3.5% fall, all of the trading yesterday still lies within the boundaries of last Friday's low and Monday's high. Today will be a revealing session, I believe, and needless to say, further weakness at this key juncture would shift me towards the imminent rollover view for US equities
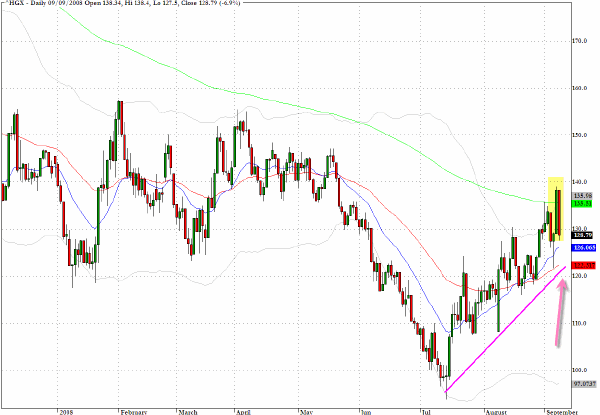
The PHLX Housing Sector index (^HGX) discussed here yesterday met rejection at the 200-day EMA but it would have been more surprising if it had just sailed through this fairly obvious price barrier.
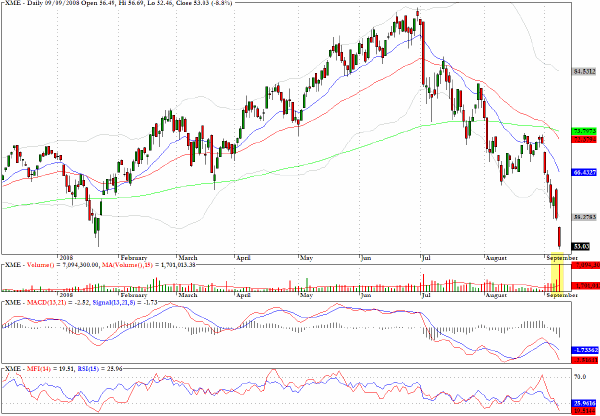
The last time I was interviewed on CNBC's European Closing Bell, about two weeks ago, I discussed the metals and mining sector and suggested that XME was on the verge, after completing the third step in a downward staircase pattern, of a steep fall in the light of a very bearish pattern.
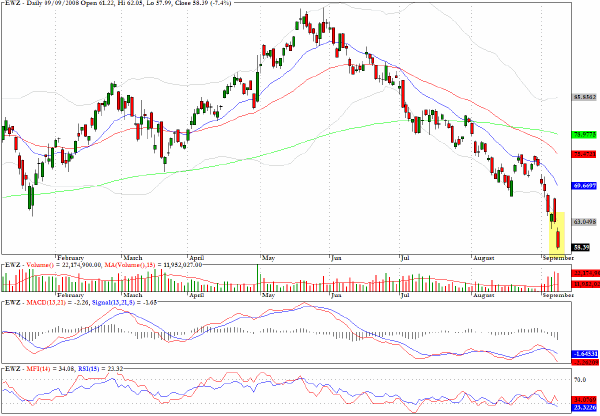
Mentioned here yesterday, taking a short position following the bearish reversal in Monday's trading for EWZ, which tracks the Brazilian market, could have provided an eight percent return yesterday.
Clive Corcoran is the publisher of TradeWithForm.com, which provides daily analysis and commentary on the US stock market. He specializes in market neutral investing and and is currently working on a book about the benefits of trading with long/short strategies, which is scheduled for publication later this year.
Disclaimer
The purpose of this article is to offer you the chance to review the trading methodology, risk reduction strategies and portfolio construction techniques described at tradewithform.com. There is no guarantee that the trading strategies advocated will be profitable. Moreover, there is a risk that following these strategies will lead to loss of capital. Past results are no guarantee of future results. Trading stocks and CFD's can yield large rewards, but also has large potential risks. Trading with leverage can be especially risky. You should be fully aware of the risks of trading in the capital markets. You are strongly advised not to trade with capital.
|