| Corcoran Technical Trading Patterns For September 11 |
| By Clive Corcoran |
Published
09/11/2008
|
Stocks
|
Unrated
|
|
|
|
Corcoran Technical Trading Patterns For September 11
Reviewing charts today I was struck by the number of inside day patterns on individual stocks as well as sector funds. The market's digestion of the Lehman news was fairly muted and I have the sense that the market is preparing for a directional breakaway move.
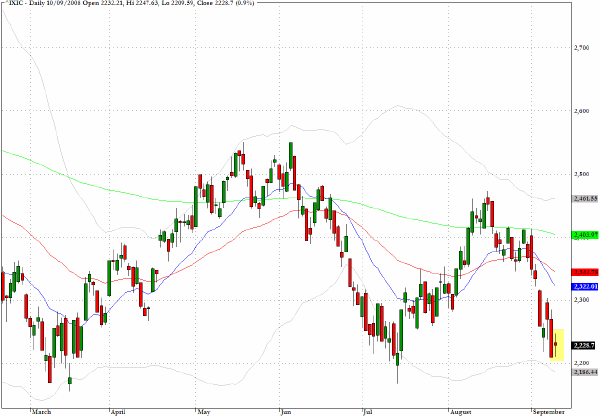
The chart for the Nasdaq Composite (^IXIC) reveals the inside day pattern in the vicinity of the 2008 lows and, as I discussed during a TV appearance yesterday, the tech stocks have relinquished their claim to any leadership role for the bulls. It remains to be seen whether they will now lead us downwards.

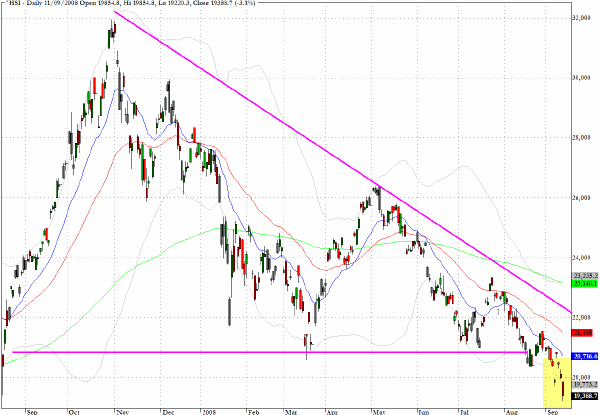
Trading in Asia on Thursday was pretty grim with the Hang Seng Index (^HSI) dropping more than 3% and falling decisively below the 20,000 level. The pattern that I have marked on the chart illustrates a downward wedge pattern breakdown. This is what I am also seeing on many other global index charts and is, I would suggest, clear evidence of the deleveraging process that is taking place as hedge funds are being forced to reduce their risk exposure and are facing client redemptions.

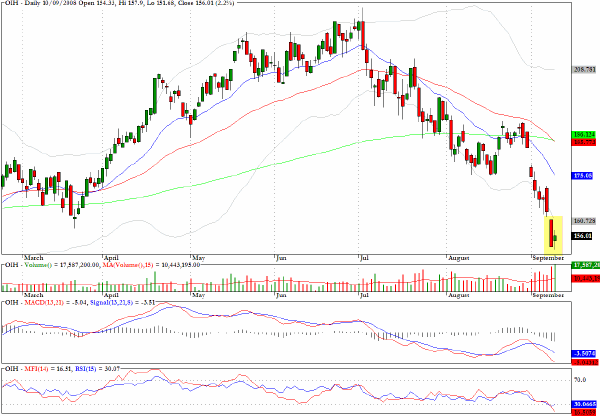
I am looking at those ETF's that are showing interesting money flow characteristics as this is definitely a market where the large funds are actively engaged in sector rotation strategies. Although there is nothing very revealing in the price pattern I would suggest keeping an eye on OIH which tracks the oil services sector as it appears to be sold out.

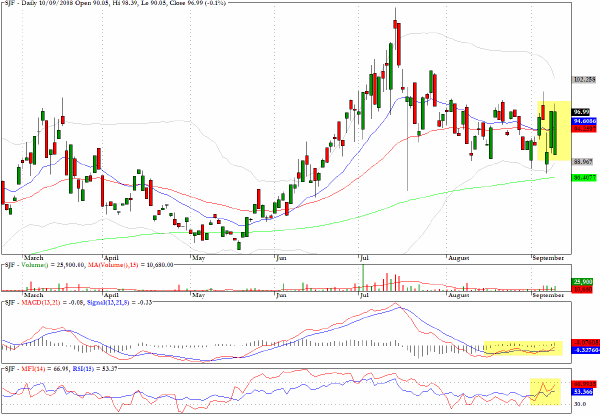
The Ultra Short funds have been very rewarding recently, and the price and volume action in SJF, which is an inverse leveraged play on the Russell 1000 Value index, suggests that some sizable bearish bets are being made here.

Clive Corcoran is the publisher of TradeWithForm.com, which provides daily analysis and commentary on the US stock market. He specializes in market neutral investing and and is currently working on a book about the benefits of trading with long/short strategies, which is scheduled for publication later this year.
Disclaimer
The purpose of this article is to offer you the chance to review the trading methodology, risk reduction strategies and portfolio construction techniques described at tradewithform.com. There is no guarantee that the trading strategies advocated will be profitable. Moreover, there is a risk that following these strategies will lead to loss of capital. Past results are no guarantee of future results. Trading stocks and CFD's can yield large rewards, but also has large potential risks. Trading with leverage can be especially risky. You should be fully aware of the risks of trading in the capital markets. You are strongly advised not to trade with capital.
|