NASDAQ COMMENTARY
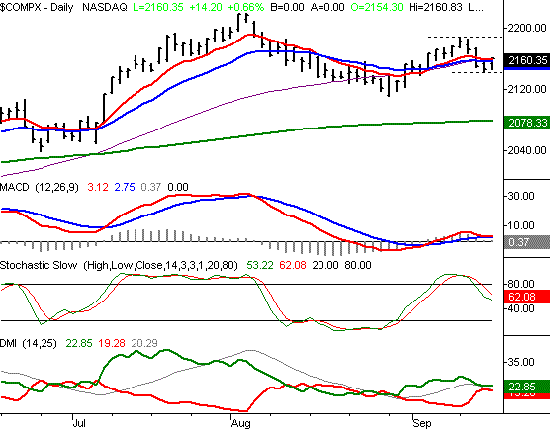
The NASDAQ fell from 2175.51 to 2160.35 last week. That 15.16 point dip into the red ink represented a pullback of 0.7 percent, but it could have been worse. Despite the selling, the composite still managed to claw its way back above the 10 and 20 day lines by the time Friday's session ended.
The bottom line is this - mixed signals. A falling index is a falling index, and we have to assume that the trend currently in place is the one that will stay in place. And despite Friday, we were still in the hole for the week. On the other hand, the NASDAQ got back above the short-term moving averages on Friday....as well as the 50 day line. That's the first half of a buy signal; the second half will be a higher close. See the duality? To aggravate the issue, the MACD lines have flattened, and the DMI lines are turning around.
So what do you do? Sit tight and let the market show its hand. We're just coming off a pretty violent expiration week, and a lot of things got twisted around over the last few days. In the short run, besides the 10, 20 and 50 day lines, look to support and resistance for guidance. The recent low is 2142, and the recent high is 2186 (all achieved this last week). All those moving average lines we mentioned are pretty much right in the middle of that range. So, all the milestones are lined up, just waiting to be surpassed.
NASDAQ CHART - DAILY

DOW JONES INDUSTRIAL AVERAGE COMMENTARY
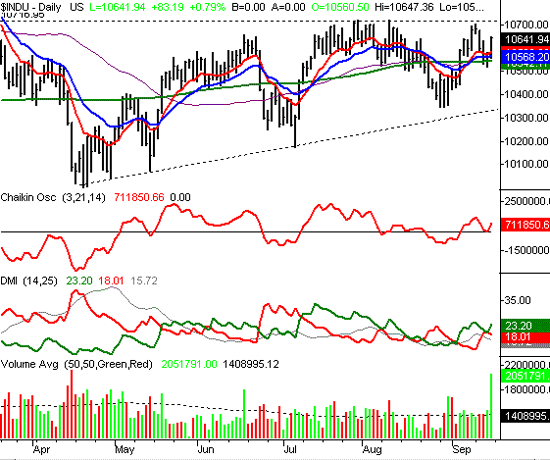
The Dow Jones Industrial Average continues to be a top performer - a nice change of pace for the blue chips that had been lagging all year. The Dow still lost some ground in the move from 10678.56 to 10641.94. However, that 36.62 point tumble was only a 0.3 percent dip. That small loss rivals the S&P's, as does the support that the Dow found at some of the key moving averages.
So, the story here is the one you read above - a loss for the week is technically bearish, but the big bounce on Friday is turning some heads. There are a couple of unique things about the Dow, though, worth a much closer look.
First and foremost, take a look at the volume bar for Friday - it's huge! It was the highest volume day we've seen for the Dow since April 15th. Back in April, that volume spike was the end of the downtrend. Will Friday's volume spike then be the end of the bull trend? In this case, we don't think the two days are going to be mirror images. Rather, we think this huge buying spree is an indication that the market seems to feel much better about stocks than they did earlier in the week. By the way, these big volume days are how significant bull runs start. So, this is at least getting interesting. Yeah, the volume was concentrated to a minority of stocks, but that's the way it always is.
The other key pattern we see on the chart is a little more typical - support at the converged 10, 20, 50, and 200 day lines. Those support lines provided a springboard for the Dow to move up to 10,642 by the end of the week. That's less than 80 points under some major resistance at 10,720, so again, the prospects here are getting interesting. And based on what we see right now, the momentum is good enough to carry the Dow past that mark - and really get things moving.
Given that the 'wait and see' strategy applies to the other indexes, it may as well as apply here too. That last 80 points can be gained in a day or less for the Dow too, but it's more of a stretch for these slower moving mega-caps (then again, the Dow has put up the biggest numbers the last couple of weeks).
DOW JONES INDUSTRIAL AVERAGE CHART

Price Headley is the founder and chief analyst of BigTrends.com.