| Sentiment Indicators Showing Fear And Panic |
| By Price Headley |
Published
09/11/2008
|
Currency , Futures , Options , Stocks
|
Unrated
|
|
|
|
Sentiment Indicators Showing Fear And Panic
We tend to view these indicators in a "contrarian" fashion, so when panic spikes are high, it usually means a market bottom is near (at least a short-term one). I've been seeing some definite fear entering the marketplace in these indicators that I wanted to discuss today.
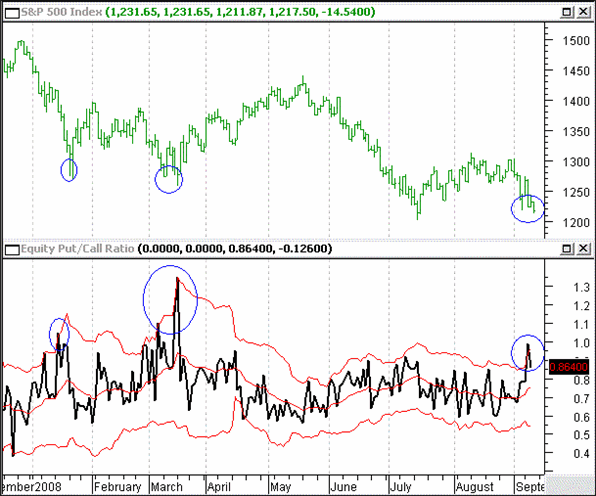
The CBOE Equity Put/Call Ratio (EPCR) is a sentiment indicator that we have followed for some time. It shows the number of puts versus calls traded on the Chicago Board Options Exchange (CBOE, the biggest options exchange in terms of volume). Our contrarian view tends to be that when put buying reaches extreme levels vis-a-vis call buying, then to some degree fear/panic has set in among speculators, and this may in fact mark a short-term reversal point for the stock market to move higher.
If you examine the following chart, you can see that the EPCR has been in the bottom half of its Bollinger Bands basically since April of this year, indicating a lack of fear among option traders. This even occurred when the market had its big drop from May to July. However, we have just seen the first "spike" in this indicator in some time, where we have hit the Top Bollinger Band. If you look closely at the chart below, you can see the last 3 times we spiked up to hit the Top Band, the market rallied shortly after, although it may have taken a few days to kick in.
S&P 500 Index (top) & CBOE Equity/Put Call Ratio (bottom)

The other main sentiment indicators we look at in the Nightly Update are the CBOE Volatility Index (VIX) and the Rydex Ratio (which is a measurement of mutual fund bearish/bullish sector switching). These indicators are also showing a lot of fear among traders in recent days. The VIX, which currently around 25.89, has been moving above its Top Bollinger Band for several days now. There is the possibility that the VIX can go as high as 30 before it is likely to reverse lower in line with a market rally.
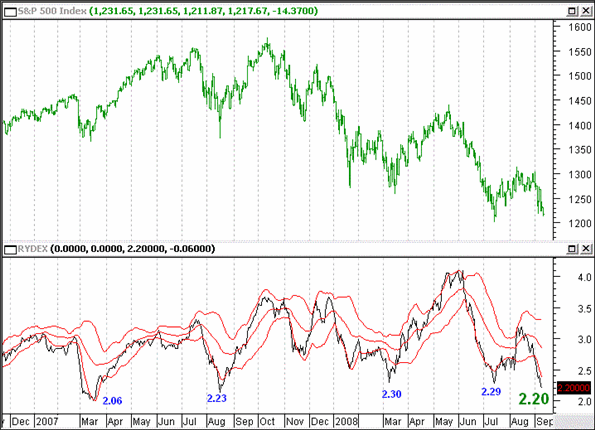
The Rydex Ratio has actually hit its lowest levels since February of 2007 this week, indicating that mutual fund traders are the most bearish they've been in some time. The previous times it has spiked this low since that time, the market has tended to rally strongly, as the following chart shows.
S&P 500 Index (top) and RYDEX Ratio (bottom)

So are we definitely at a bottom today? No. However, my sentiment analysis of the EPCR and RYDEX indicates to me that there is definitely fear & panic setting in among many traders, which is often a great time to prepare to go long. The S&P 500 Index, currently around 1219, has strong support around the 1200 strike, and that looks like a likely place for an upside reversal, in my view.
Price Headley is the founder and chief analyst of BigTrends.com.
|