| Outlook On The Stock Indices |
| By Price Headley |
Published
09/21/2008
|
Stocks
|
Unrated
|
|
|
|
Outlook On The Stock Indices
What can you say following the most volatile week we've seen in years? Also at one point last week, we had seen the biggest plunge since immediately after 9/11. Later in the week, we saw the best two day rally in years. Neither was expected, particularly one following the other. Needless to say, it really shook charts up.
So, to make an assessment at this point is a little bit presumptuous. However, we still want to give you a glimpse of what we see going on, so we know how to proceed as the coming week unfolds.
NASDAQ Composite
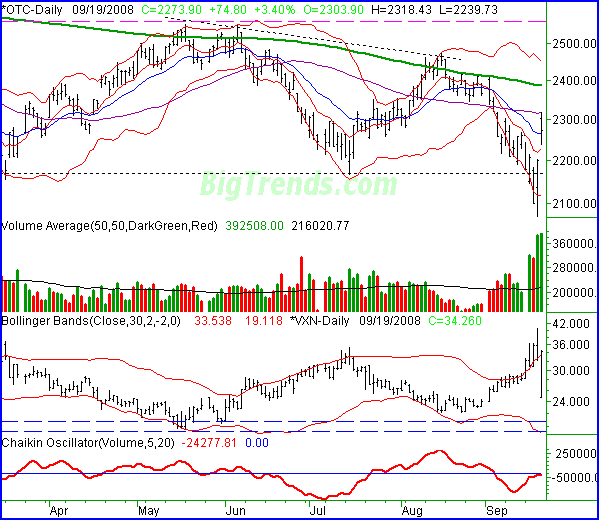
The close at 2273.9 on Friday was the result of the NASDAQ's 3.4%, or 74.8 point rally. Even better was the positive weekly gain of 0.56% (+12.63 points). However, was Friday too much, too fast? There's a big lingering gap beneath Friday's low of 2239.73, and Friday's high was seen right as the 50-day line was touched. Those are two big tripwires the bulls need to be concerned about. And, if Friday's fade is any hint, they are indeed worried about it.
The VXN is worthless right now. Friday came and didn't even give the VXN a chance to roll over in the middle of the day. In fact, the VXN was pushing upward as the day went on. Maybe it was just expiration pressures (triple-witching, no less). We'll need to see how the VXN shapes up early in the coming week before trying to interpret it.
And volume,which also got interesting for the Dow, may also be telling us the long-term pivot is in place. Big spikes in volume often accompany reversals. It's still too soon to say at this point if that's what's happening here. But, it's a distinct possibility.
The problem is just that things got too volatile after the Fed and Treasury "bought" Friday's rally. That's no trend. It was just a jump. Trying to decipher where the market's headed next is a coin toss, so let's see what happens in the coming week when heads are screwed on straight again.
NASDAQ Composite Chart - Daily

S&P 500
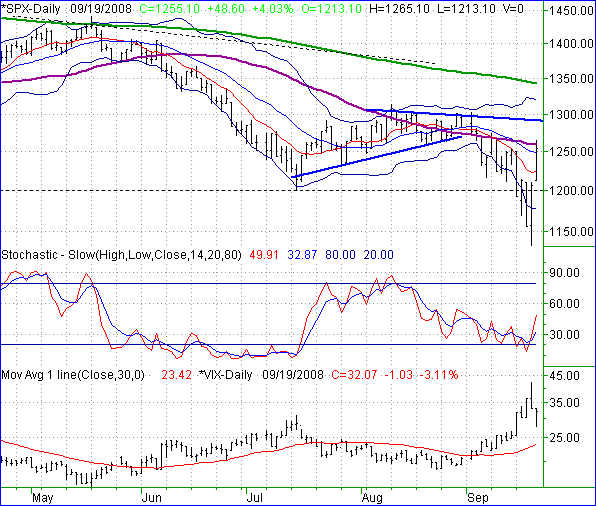
The S&P 500's 4.03% gain on Friday, the best of any index, was good enough to get in back in the black for the week, though barely. The SPX gained 3.4 points last week (+0.27%) to close out at 1255.10.
Unlike the NASDAQ, the S&P 500 actually ended the day trending higher. Like the NASDAQ though, the rally was halted at the 50-day moving average line (purple), and there's a small gap the bulls will be keeping in the back of their heads as well.
And the VIX? Yeah, that got pretty skewed too. As of Thursday it looked like fear had peaked, a bullish hint. On Friday though, the VIX made a harsh drop after a considerably lower open. But, it spent the rest of the day regaining that loss, and ended the day trending higher as well. That's bearish based on the last direction we saw, but still bullish of Thursday does end up acting as a peak.
So, for Monday we're doing nothing except watching. If we can close the gap (and the sooner the better) and then push higher again, that's bullish. Even then though, there's more resistance just above at 1290.
If we linger around Friday's closing level without seeing any effort to actually move above the 50-day line, that's actually bearish. As for as support goes, don't worry about it. The sharp dip early in the week took out any meaningful support lines.
S&P 500 Chart - Daily

Dow Jones Industrial Average
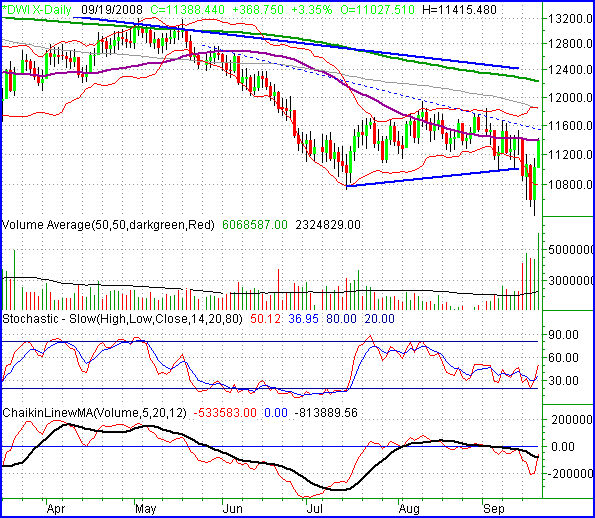
The Dow Jones Industrial Average rallied 3.35% on Friday to end the wild session at 11,388.44. That 368.75 point gain for the day still wasn't enough to offset what ended up being a 33.55 point loss for the week. Still, considering how bad things were as of Wednesday, that's not a bad week.
Despite all that volatility though, the Dow is still no better or no worse off than it was at this time last week. The 50-day average line (purple) at 11,393 is still the key in the short run, and getting above the intermediate-term resistance line (blue, dashed) at 11,538 is an important hurdle if the bulls are truly going to take control again.
One thing we want to specifically mention here is volume. The recent surge in volume may well indicate a pivot, or turning point. It won't be clear until we see how the Dow escapes this past week. But, major reversals are often flagged by this kind of high-volume activity since 2006 (and those were anomalies). The point is, you don't have to doubt it if this week appears to have been the bottom of a bear market.
Dow Jones Industrial Average Chart - Daily

Price Headley is the founder and chief analyst of BigTrends.com.
|