| Outlook On The Stock Indices |
| By Price Headley |
Published
09/28/2008
|
Stocks
|
Unrated
|
|
|
|
Outlook On The Stock Indices
NASDAQ Composite
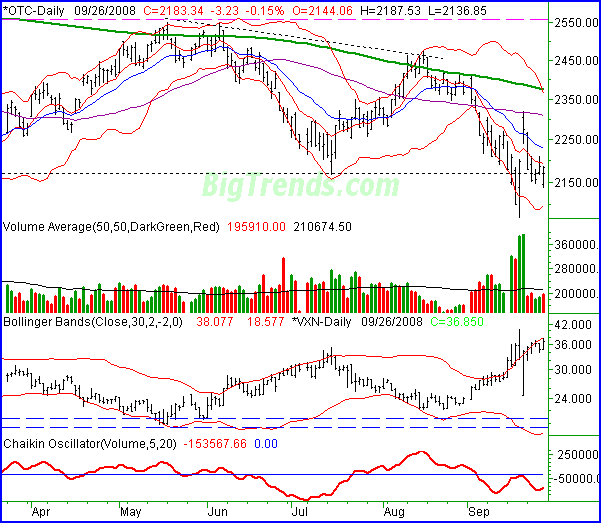
The NASDAQ fought back on Friday after a bearish open, but still only managed to close slightly in the red. It lost 3.23 points (-0.15%) for the day. For the week, it still lost quite a bit more, closing lower by 90.56 points (-3.98%). However, the vast majority of that loss was taken on Monday.
The ridiculous surge from two Friday's ago was just too much to follow. And, the market didn't particularly when Washington failed to deliver on the promise of a bailout package. Hence, Monday's sharp sell-off. The rest of the week though was actually pretty flat.
You'll also notice there was very little volume all week long, even Monday. It looks like traders are just waiting to see if the package gets passed, and what it will entail. So, we're inclined to wait as well.
Assuming the bailout is legitimate and the price tag is close to the projected $700 billion, investors could be compelled to start buying again. The question, however, is longevity. A smooth, calculated move back above the 20-day average line (blue) at 2228 would be a great start. The VXN, however, would also have to keep sinking. A close under 33.94 would be a good start.
NASDAQ Composite Chart - Daily

S&P 500
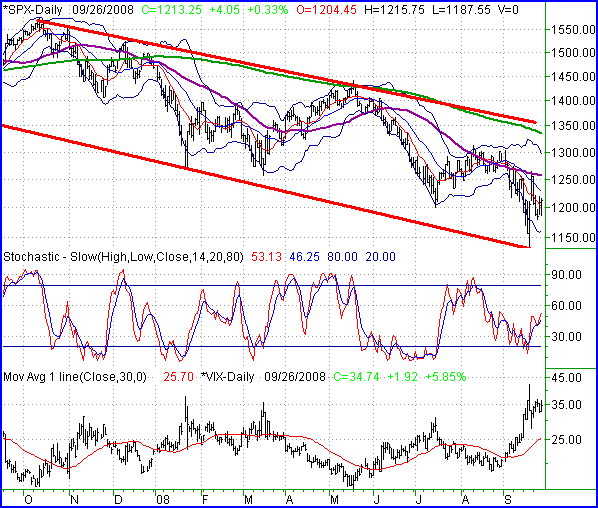
The S&P 500 managed to close slightly in the black on Friday, gaining 4.05 points (+0.33%). On a weekly basis though, that was still down 41.85 points (-3.33%). However, things at least ended on a modestly positive note.
That positive note was a close above the 10-day moving average line (red) at 1203. Except for the 19th, it's the first time we've seen it happen since August.
Even so, we know not to be too trusting here, so we wouldn't plan on sustaining any kind of uptrend until the 50-day average (purple) at 1257 was surpassed. And even then we're skeptical - just see August to understand why. Really, the 200-day line (green) at 1336 is the line in the sand.
That being said, the VIX's peak may be fuel for such a fire. We hadn't seen a good peak in fear like this one in years, so this really could be something close to a bottom. When the VIX closes under 32 again (and of the market starts to rise again) that should be bullish for stocks for longer than just a few hours.
Bear in mind there's a much bigger force at work here though. The trading range framed with thick red lines. More than anything else we're thinking about mere bounces inside that range until it's broken.
S&P 500 Chart - Daily

Dow Jones Industrial Average
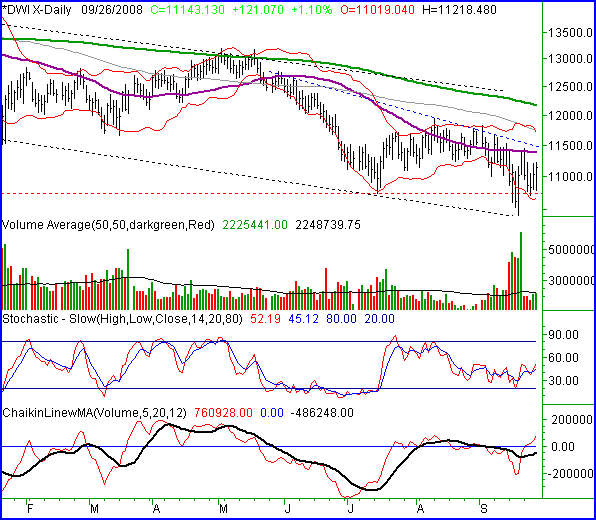
The Dow actually did very well on Friday, topping the other indices by gaining 121.07 points (1.1%) to close out at 11,143.30. That was till 245.31 points below (-2.15%) the prior week's close, but the end of the week was quite encouraging for the bulls.
Are blue chips back en vogue? We saw some decent volume from the Dow behind Thursday's and Friday's gains. Granted, most of it was from renewed interest in financials, but of this bailout package makes a dent, the financial stocks could lead the market higher again just as they led the market lower in the first place.
That's not to say we're bullish yet - we're waiting for a move above the 50-day line as well as that short-term resistance line (blue, dashed) before we get too excited. However, we also want to point out we already have a bullish Chaikin line (volume indicator).
A move above 11,500 is our bullish line in the sand. A close under 10,700 could be trouble for the bulls, or great for the bears. Like the S&P 500, the Dow is still caught in a long-term, bearish trading range.
Dow Jones Industrial Average Chart - Daily

Price Headley is the founder and chief analyst of BigTrends.com.
|