| Corcoran Technical Trading Patterns For September 30 |
| By Clive Corcoran |
Published
09/30/2008
|
Stocks
|
Unrated
|
|
|
|
Corcoran Technical Trading Patterns For September 30
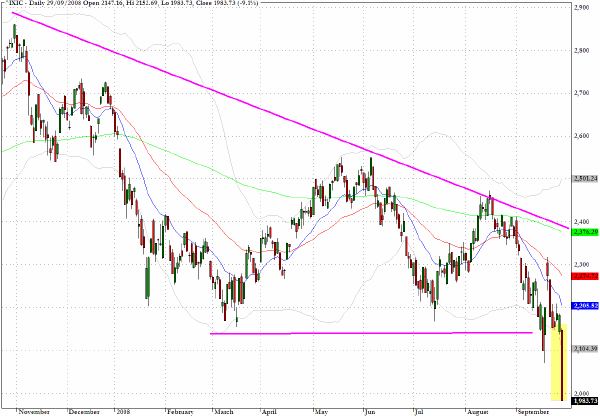
One of the most extraordinary charts from a historic day of trading is the one for the Nasdaq Composite (^IXIC) which almost dropped 200 points and registered its third largest decline ever with a 9.1% drop.
The reason why I find it especially alarming is that the markets have been precoccupied with sorting out the debris from toxic assets and de-leveraging but seemed to have been overlooking lots of evidence that consumers are withering.
The focus today will be on letting the charts themselves reveal the dramatic and precarious state of the capital markets.
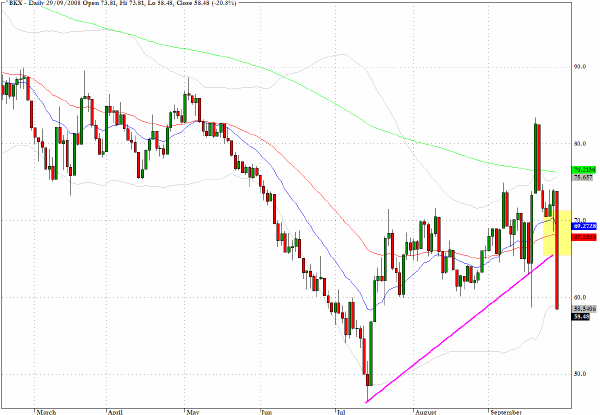
The KBW banking index (^BKX) fell back a breathtaking 20% plus and violated a critical trend-line from the July low. If the smart money is right, this is the time to be buying within the sector - the key is to know which banks will be left standing when it is all said and done.
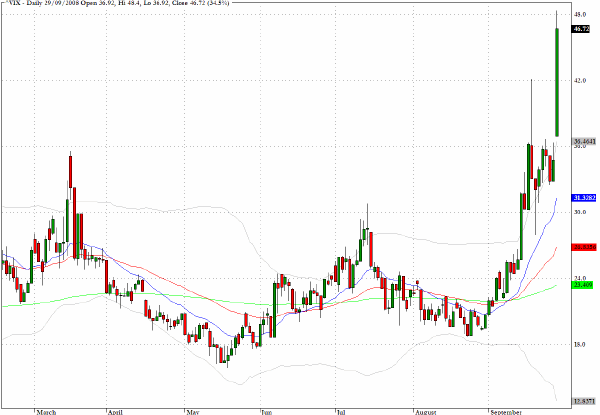
The CBOE Volatility Index surged to almost unprecedented levels yesterday
I found the following commentary useful from a site dedicated to the volatility index:
The VIX set a new record today, with a closing price of 46.72. This record surpassed the previous record of 45.74 from October 8, 1998, which came during the Long-Term Capital Management fiasco.
Today also saw an intra-day high of 48.40 that is now the fifth highest intra-day VIX reading, behind a 49.53 reading also from October 8, 1998.
For the record, October 8 was toward the end of the panic associated with LCTM. It was the 18th day in a 1 1/2 month period that the VIX traded over 40. Following the record readings, the VIX hit 40 on each of the next four days, then did not trade in the 40s again until after the 9/11 World Trade Center attacks.
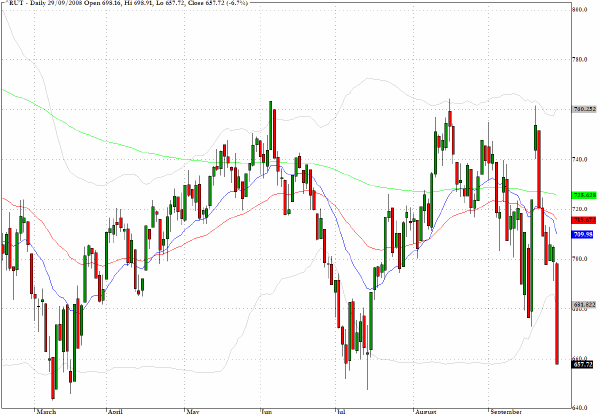
The Russell 2000 (^RUT) did not (yet) break decisively below the previous lows this year.
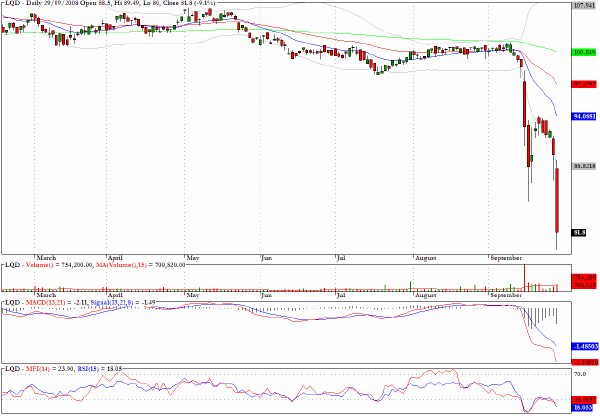
I shall repeat my comments from yesterday - "Threats of financial contagion are crippling the investment grade corporate bond sector. LQD would be worth monitoring today."
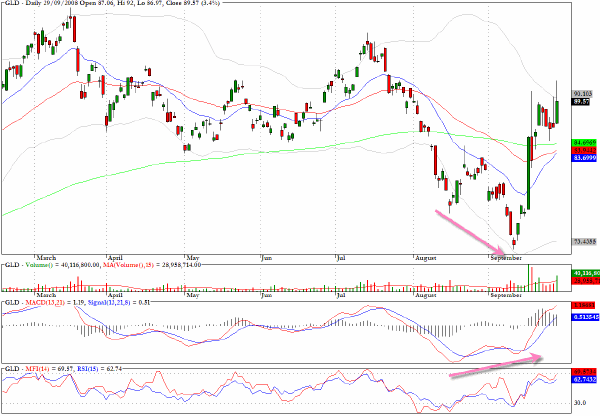
Last week's suggestion that the sector fund GLD was a buy has proved timely. Apart from nearly all of the inverse and leveraged exchange traded funds it was one of the very few to end with a green candlestick yesterday.
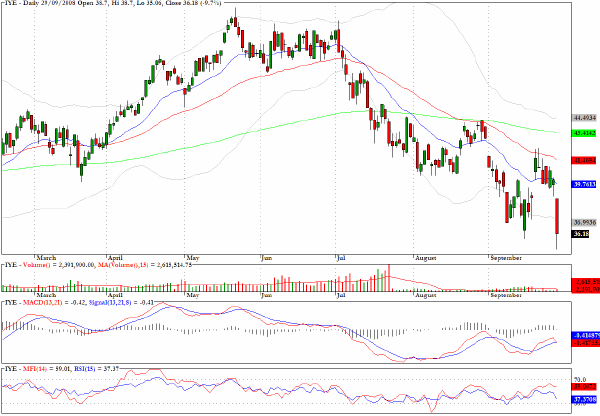
Yesterday's comment about IYE was not well timed and highlights the dangers of using certain indicators when we are in uncharted waters.
Clive Corcoran is the publisher of TradeWithForm.com, which provides daily analysis and commentary on the US stock market. He specializes in market neutral investing and and is currently working on a book about the benefits of trading with long/short strategies, which is scheduled for publication later this year.
Disclaimer
The purpose of this article is to offer you the chance to review the trading methodology, risk reduction strategies and portfolio construction techniques described at tradewithform.com. There is no guarantee that the trading strategies advocated will be profitable. Moreover, there is a risk that following these strategies will lead to loss of capital. Past results are no guarantee of future results. Trading stocks and CFD's can yield large rewards, but also has large potential risks. Trading with leverage can be especially risky. You should be fully aware of the risks of trading in the capital markets. You are strongly advised not to trade with capital.
|