| Outlook On The Stock Indices |
| By Price Headley |
Published
10/5/2008
|
Stocks
|
Unrated
|
|
|
|
Outlook On The Stock Indices
NASDAQ Composite
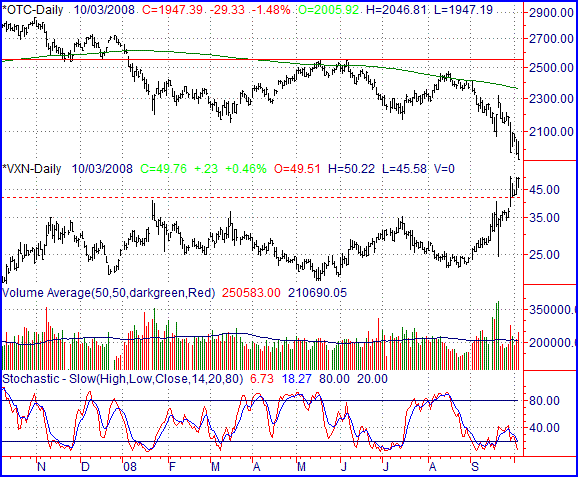
Losing another 1.48% on Friday (-29.33 points) led the NASDAQ to a weekly loss of 10.81% (-235.95 points), closing it out at 1947.39. That's the lowest close since 2005, and 32% below the November peak.
The ingredients for a rebound are certainly in place. We're stochastically oversold, and near record-breaking losses for the week have left the NASDAQ as far away from its mean/average line as we've seen in years. Plus, the VXN is starting to stall is it runs into multi-year highs.
Being ripe for a reversal, however, doesn't mean it's going to happen. At this point, we're looking for a few key things to act as an 'all clear' signal.
The VXN needs to make a couple of lower closes. A move back under 42 will be critical. The Composite itself needs to start moving higher again (obviously). By this, we just mean it needs to move higher from more than one day. These days should also be on better-than-average volume.
Can the NASDAQ keep moving lower? Perhaps, though it would be history-making to add on more losses (immediately, anyway) following last week's huge selloff. Nevertheless, in light of our stipulations for bullishness, were clearly not convinced that a rebound is looming.
NASDAQ Composite Chart - Daily

S&P 500
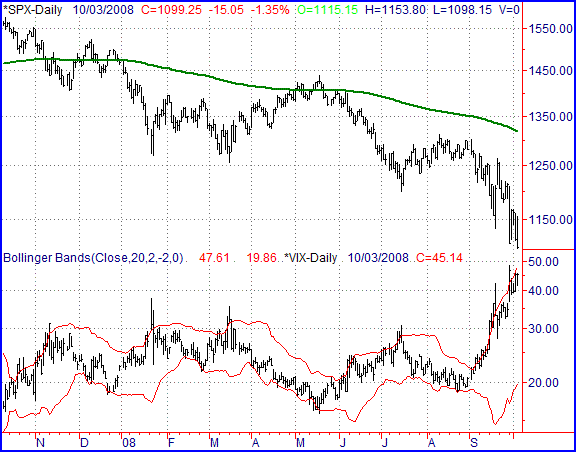
The S&P 500 gave up another 1.35% (-15.05 points) the last day of last week, to end at 1099.25. That was 9.4% under the prior week's close (-114.0 points), and also happened to be the worst week in years. Then again, we've seen a lot of things happen in the last few weeks that were multi-year firsts.
Just to give you some scope on how nasty things have been recently, the S&P 500 is now 16.6% below the 200-day moving average line (green). That's the widest disparity we've seen since late 2002 - late in the bear market. The good news is, that was also the end of the bear market. The bad news is, the index didn't start to turn around until it was a full 20% below the 200 day average line. So, yes, the S&P 500 is more than capable of losing more ground until it just becomes too much for the 'value-seekers' to pounce on.
So, as with the NASDAQ, our bullishness is conditional. The index needs to start moving higher. More importantly though, we'd like to see the VIX start moving lower. A close or two under 39.0 would be a good start.
S&P 500 Chart - Daily

Dow Jones Industrial Average
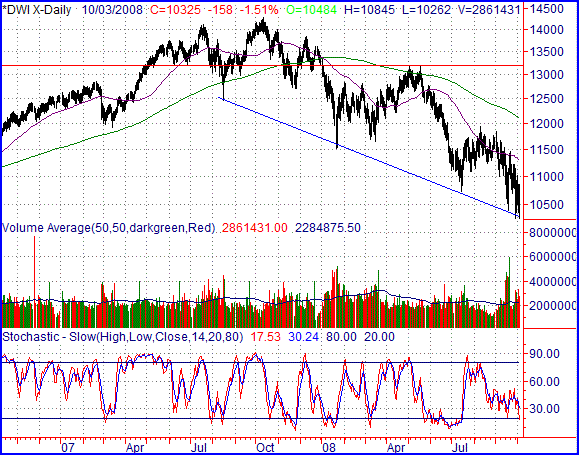
Friday's close of 10,325 for the Dow was the result of a 1.51% dip (-158 points). That close was also 7.34% under the prior Friday's close (-818 points), one of the worst weeks in years.
The big sell-off did do one thing that was bullish. It redefined a key support line that extends back to August of last year. It's not been a laser-precise line (blue), but it's been close to it. Assuming the pattern is repeated, the Dow should be able to push off that line again.
If the line fails to hold up as support, that could start a big freefall. Even then, such a tumble should be the last one of this bearish phase, and set up the beginning of a new bull market. I think the market is fishing for a major bottom one way or another.
Dow Jones Industrial Average Chart - Daily

Price Headley is the founder and chief analyst of BigTrends.com.
|