| Is The VIX Too Overextended? |
| By Price Headley |
Published
10/11/2008
|
Currency , Futures , Options , Stocks
|
Unrated
|
|
|
|
Is The VIX Too Overextended?
There are many ways to analyze the CBOE Volatility Index (VIX), so we'll look at three main perspectives and what each says about expected future action. The VIX has nearly tripled in value since September and as of this week there are VIX October 90 Calls trading around .75, the highest strike price traded to my knowledge. Using traditional analysis, the VIX is overextended; however, this market is not traditional, which calls for non-traditional analysis.
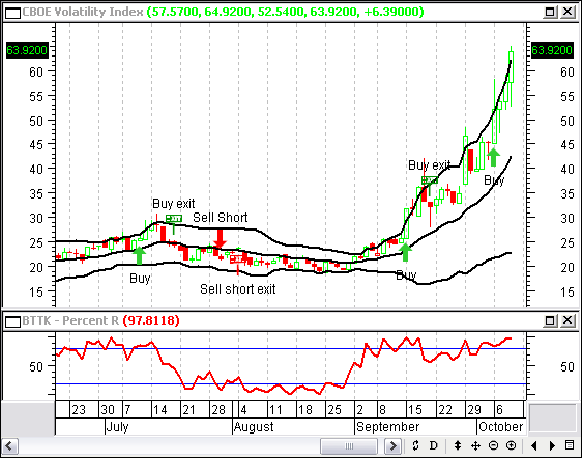
Typically, we look for extremes in the VIX and because extremes are statistically improbable these become reversal points for the VIX and the market. Extremes can be quantified by Bollinger Bands (20 day, 2 standard deviations) and when the VIX closes outside the bands an extreme is reached. The problem? This signal occurred four times in the recent growth trend and still no reversal. OK, in comes a new perspective, William's Percent R, an oscillator that traditionally shows overbought versus oversold.
Percent R
Since September when the VIX started to resemble a growth stock in the late 90s William's Percent R has worked well with the VIX. In the daily chart below, we have buy signals (on VIX) based on Percent R confirmations, which is based on %R crossing above 80 and a subsequent VIX confirmation at the close. Based on these signals traders would short the market or buy VIX calls. Percent R has worked even better on a 15 minute VIX chart; this would be helpful for market timing with day traders. How do you know when the VIX is coming back down? Based on Percent R we'll be looking at two levels, the 80 and 50 level, a cross below 80 would be a great set up to take off your bearish market exposure whereas a cross below 50 would be a real signal to start adding to your long portfolio.
VIX Daily - Bollinger Bands & Williams Percent R

Bollinger Bands
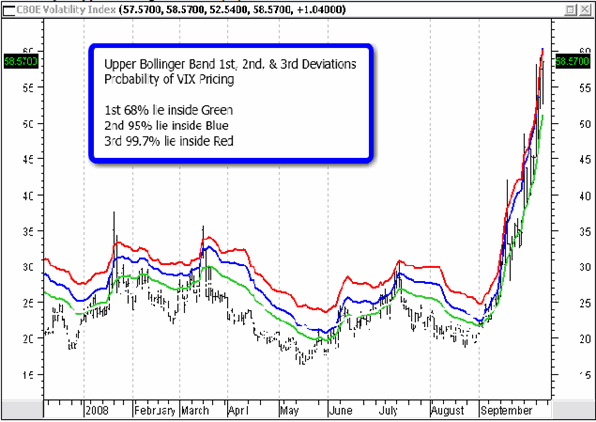
Statistically, price action can be expected to stay with in a normal distribution, based on three standard deviations. In the chart below, you can see the likelihood of price action in each deviation-the more standard deviations from the mean the less likely price action will break outside. The further outside the mean the VIX goes the more likely it is to reverse. Perhaps the strongest signal is any price action outside the 3rd deviation, which rarely occurs (less than .5% of the time), this has occurred multiple times in the past two weeks. The RED line below signifies the three deviations away from the mean-you'll notice in recent VIX history a spike outside the red line leads to a reversal. What's concerning is three recent spikes above the red line meant nothing, as if the laws of mathematics have departed. Bottom line, the VIX is overextended based on Bollinger bands, which simply means a reversal is likely.
VIX Daily - Upper Bollinger Bands 1, 2, 3 Deviations

DMI Difference
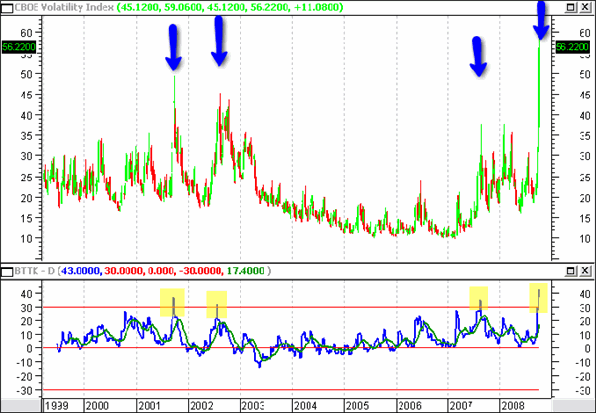
Sometimes forgotten, but always helpful, DMI Difference is a great indicator to define persistent trends, but it's also a great tool in defining overextension. Taking a step back on the WEEKLY chart we can see the VIX pattern in 2001 and the respective highs. The 2001 high was 49.35, a significant number until this week. Absolute highs are great for making statements, but relative highs are far more important. In any case, notice the lower window where DMI Difference coincided with the price action of the VIX, instead of gauging extremes on the VIX look at the extremes on DMI Difference. We quantify a general extreme on the upside as above 30 (top, red horizontal line). This is the highest DMI Difference has reached on the VIX, which all but solidifies a reversal extreme for the market.
VIX Weekly Chart - DMI Difference

Price Headley is the founder and chief analyst of BigTrends.com.
|