| Outlook On The Stock Indices |
| By Price Headley |
Published
10/12/2008
|
Stocks
|
Unrated
|
|
|
|
Outlook On The Stock Indices
NASDAQ Composite
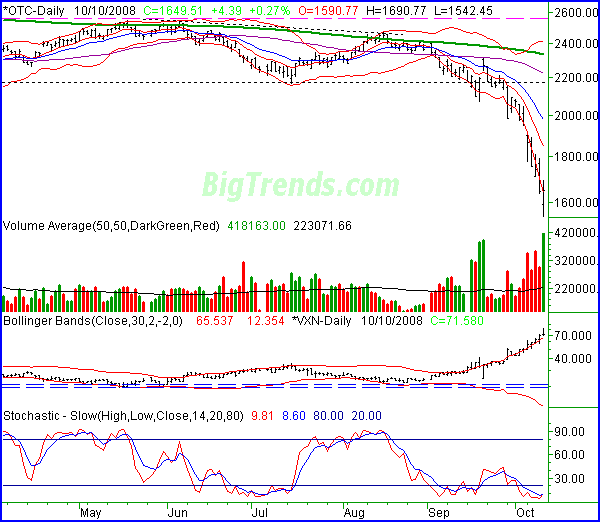
The NASDAQ turned things around on Friday to end the day in the black, closing higher by 4.39 points (+0.27%) to end the session at 1649.51. The composite had been as low as 1542.45 at one point in the day, the lowest low in years. For the week, the NASDAQ closed 15.3% lower (-297.88 points).
Though the momentum is clearly bearish, reason also plays a role in our outlook. How much lower can the market go? Yes, it can always go lower. However, what are the odds of it going lower?
On that note, we're particularly interested in what happened late in the day with the NASDAQ. It ended pointed higher. What changed? That's the point. Nothing really changed, except maybe the momentum. The market's certainly oversold enough to inspire a dead-cat bounce. Perhaps it was started on Friday. Only follow-through on Monday will tell the tale though. A higher range and a higher close on strong volume would be a big clue.
The VXN (the NASDAQ's VIX) also hit record highs on Friday, yet also hinted of trying to top out and move lower again. The open and close were both at the lower end of the bar. And, there's clearly a lot of room for the VXN to sink now. If it also starts to point lower, it will confirm any bullishness.
Bottom line is the NASDAQ is ripe for a rebound, but it hasn't actually started yet. We feel that's the better potential trade right now though.
NASDAQ Composite Chart - Daily

S&P 500
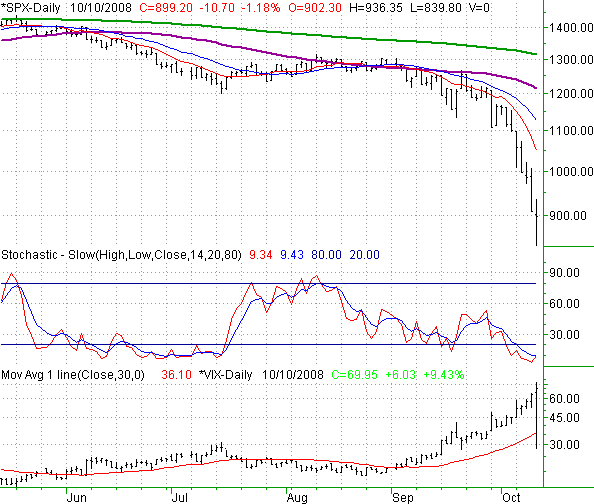
The 10.7 points loss (-1.18%) on Friday left the S&P 500 at 899.20. On a weekly basis, that meant a 200.0 points dip, or -18.2%. Yes, that was one of the worst weeks on record we're aware of.
What's there to really say here? We've never seen anything quite like this. In 1987, the pain was confined to two days. In 1998, it was compacted too. Between 2000 and 2002, the pain was drawn out in what was a normal bear market. While we've been in a bear market lately, the majority of the losses were taken over the last two weeks. It's odd to see selling stay that strong for that long.
But the fundamentals justify it? Maybe, though stocks so rarely trade based on actually values, why would they now? We know fear is rampant, and we know traders act on emotions. It's just interesting that the market was able to sustain this much for fear for this long.
This is now a waiting game. We're waiting for the bulls to tip their hand. That will come in the from of a bar with a stronger close (obviously). Perhaps Friday's Doji bar was that bar, though some follow-through on Monday will be required to confirm it. In other words, candlestick analysis is getting tons of our attention right now, while other tools have been rendered ineffective. The shape of the VIX's bar will be just as telling.
S&P 500 Chart - Daily

Dow Jones Industrial Average
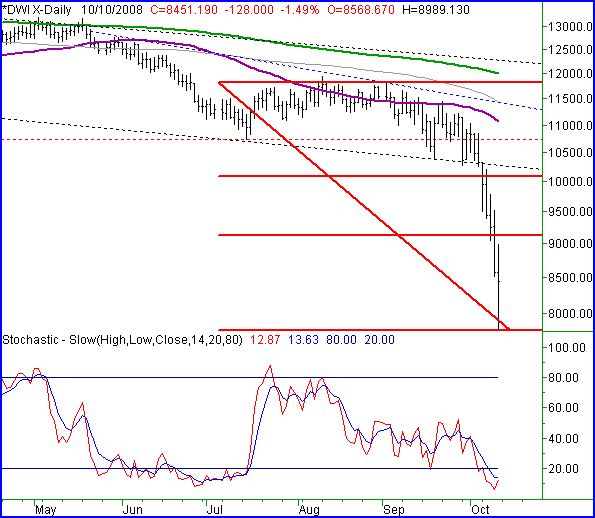
The close of 8451.19 on Friday was the result of a 1.49% selloff (-128 points), which was much better than the multi-year low of 7773.71. For the week, the Dow lost 18.15%, or 1874.19 points.
We're not going to repeat what we said above - just know the same ideas apply to the Dow. The only thing we're going to add is some Fibonacci lines, which assume Friday was indeed at least a short-term bottom.
If the bulls can get traction here, there are two milestones, each of which is a potential profit-taking level. The first is at 9127, and the second is at 10,100. If both of those are met and reached, then the 12,000 area become the key.
Now, we bring up 12,000 for several reasons, but mostly to let you know that's a major make-or-break point. That will be roughly be where the 200-day average line is by the time the Dow can retest it. And, that's where all the turbulence was before the market got crushed. If the Dow can get past all that mess, say hello to the new bull market. However, that's a big if. In the meantime, there's still plenty of trading opportunity on the way up.
Dow Jones Industrial Average Chart - Daily

Price Headley is the founder and chief analyst of BigTrends.com.
|