With the media noting last week that gold prices hit a 17-year high, we wanted to take a look at how the gold sector is performing to determine the next likely move for this inflation hedge.
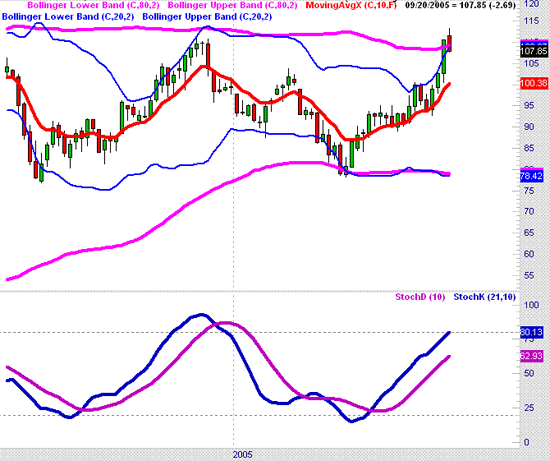
Take a look at the weekly chart below of the Philadelphia Gold & Silver Index (XAU). Even as gold prices hit a new 17-year high last week, the gold stocks as measured by the XAU actually were running into resistance seen in late 2004 (as well as similar highs not shown in late 2003 & early 2004). What does it mean that gold stocks are lagging compared to gold prices? To us it's a bearish sign that this upside rally in recent weeks is likely to stall. Typically gold stocks will run ahead faster than gold prices in a bull market for the yellow metal. That's what I saw in late 2001 and most of 2002, when gold stocks ran up quickly as gold moved from $330 an ounce to $400 an ounce. If you like to compare gold stocks to gold prices, compare the XAU to the relatively newer Streetracks Gold Trust (GLD) which tracks gold prices and can be purchased like any other ETF, just like a stock can be bought.
The caveat to my current skepticism about the gold rally's persistence is if the XAU has a weekly close over 115, which would be a bullish breakout. But until then, we are at the top of a trading range with the low of the range back near 80. A mistake many traders make is to buy short-term strength into resistance, hoping for the upside breakout. You're much better off to wait for a breakout and then get back in on retests of that old resistance that typically becomes new support.
Philadelphia Gold & Silver Index (XAU) - Weekly Chart

Price Headley is the founder and chief analyst of BigTrends.com.