| Stock Charts Don't Lie |
| By Price Headley |
Published
10/13/2008
|
Currency , Futures , Options , Stocks
|
Unrated
|
|
|
|
Stock Charts Don't Lie
Now that last week's carnage has come to an end, where do we go from here? We learned a lot last week from the worst week in the market's history and we have had a weekend to digest some of that information. After the much needed weekend break, it is worth reviewing what happened in the markets last week and how we got here from a technical perspective.
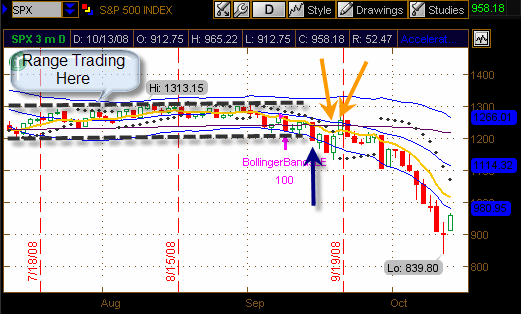
As you can see from the daily chart below, the S&P 500 had been stuck in a range for most of July and August. The chart began to break down in early September but was still quite choppy until the big gap down on September 15 (blue arrow). From there we had a fake-out to end that week on September 18th and 19th with two large rallies on the news of the AIG bailout (yellow arrows).

And that is when the market began to show its true colors. The bottom fell out of the market on Monday, September 29, as the house voted down the now infamous bailout package. As September gave way to October, investors were hoping for change as the government stepped in to stem the tide of the crisis. Those investors had forgot that hope never made anybody money in the markets.
So what happened last week? Well as we mentioned there was no confidence anywhere. Companies didn't trust other companies, countries didn't trust other countries, and investors had trust in absolutely nothing. Hope somewhat remained as people kept saying that the markets were too oversold and that a bounce was going to happen. Needless to say, they were wrong.
I mentioned above that the charts don't lie, and that never was truer than last week. If you were looking at the markets from a fundamental prospective taking into consideration P/E ratios and looking at a company's financial statements, you were lead to believe that stocks were a buy. The charts told another story. Even today in the midst of the largest one day rally in the history of the Dow (600 plus points), the market is still very oversold technically. Today appears to be a bearish retest in a volatile market, meaning more downside could be ahead.

The fundamentals can all be positive, but if investors around the world are selling the stock, then the price of the stock is going down. You can't find this information in the balance sheet or cash flows. The story is told in the charts using technical analysis to read the strength of the trend.
Governments around the world are printing money to throw at the credit markets in an effort to unfreeze them. The coordinated interest rate cuts from last week are going to weaken many major currencies around the world. We are mainly concerned here with the dollar in the coming months as we look to change presidents in early 2009.
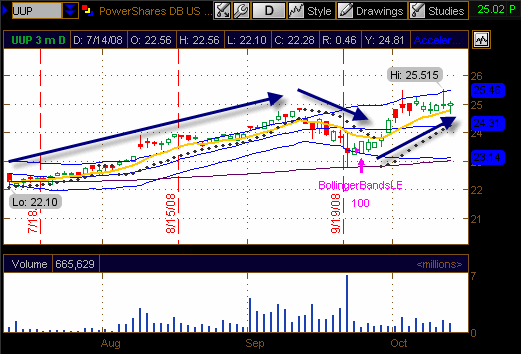
The dollar has had a fantastic run here over the past few months as shown by the dollar bullish ETF UUP below.

We are holding right around the 25 level on this ETF which is now a key resistance level. This level was put in play in early September and needs to be broken. If this level holds, then the dollar will weaken quickly.
The lingering question now is when does inflation begin to kick in with low interest rates and cash being dropped across the board by helicopter Ben? The likely answer to that is not in the near term. The main problem on everybody's mind is around credit and the banking sector. When money begins to flow naturally again, the dollar will begin to weaken. I don't think that this weakening will last too long, however, because Europe, Australia and Asia have it worse than we do here right now. They will likely be lowering rates in the coming months right about the time we will look to consider raising them.
We know that volatility like this won't last forever. As option traders, we look for volatility to catch the larger trending stocks. As volatility levels begin to revert back to the mean in the 4th quarter and early 2009, look for currency plays for nice profit opportunities.
Price Headley is the founder and chief analyst of BigTrends.com.
|