| Corcoran Technical Trading Patterns For October 14 |
| By Clive Corcoran |
Published
10/14/2008
|
Stocks
|
Unrated
|
|
|
|
Corcoran Technical Trading Patterns For October 14
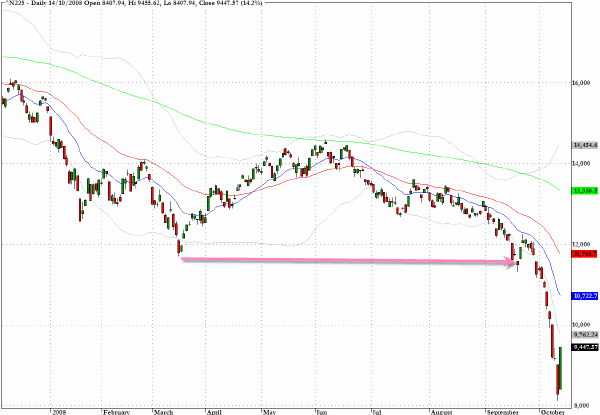
The massively oversold conditions from last week's panic produced some very sharp rebounds in yesterday's session. The Japanese took Monday off and had some catch-up to do in Tuesday's trading, and the Nikkei 225 (^N225) delivered a 14% return for the session which was its largest single day gain.
Last Friday afternoon when I was interviewed on CNBC's European Closing Bell, the European markets had just closed with epic drops, and I somewhat tentatively suggested that the return of the Nikkei to within a whisker of the 2003 low should give some grounds for comfort that there could be a respite in the selling. Seen in the context of the 26% decline that took place during the first ten days of October, the candlestick registered as a result of this morning's rally does not look as impressive as one might have suspected.
I'll talk again about this index in another CNBC slot today, and in a nutshell I think it would take a heroic effort for this index to make it back above the 11600 level any time soon.
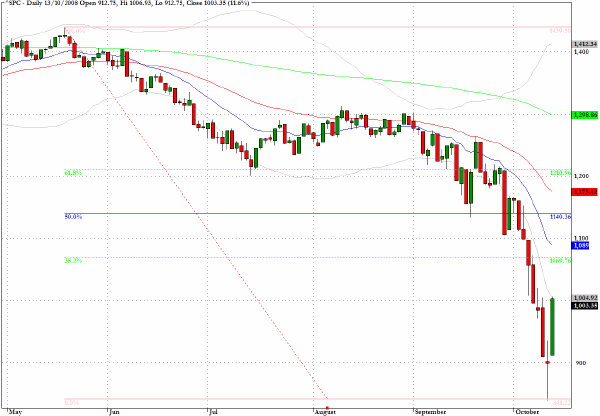
The S&P 500 (^SPX), based upon the relief that the gargantuan sums of public money being injected into the global banking system will alleviate the most acute forms of solvency concerns, should be able to sustain the newly found positive momentum for some time.
Fund managers now have to trade off their reduced anxiety that some companies, other than the banks, which last week were almost certainly contemplating insolvency are now merely facing much tougher trading conditions while the global recession takes hold.
If we take the mid-May intraday high as the top of a retracement model and last Friday's intraday low as the bottom of the framework, then 1070 would represent a 38% retracement of the move and a good place to be reducing long exposure.
I would suggest that much greater resistance should be expected at the 1140 level which would be a 50% retracement of the move and that one should be looking at the short side again.
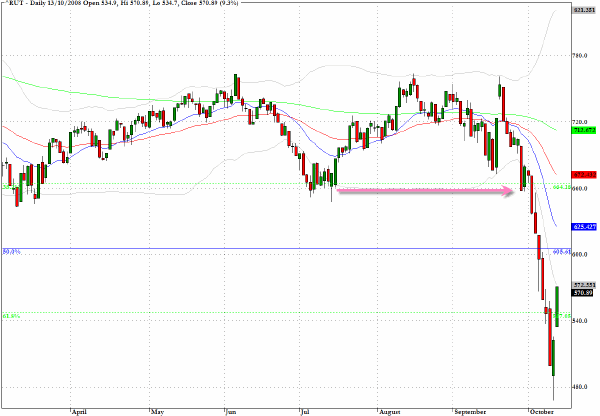
I have often suggested that the small cap stocks represent one of the most insightful barometers to overall market conditions.
My most serious concern about the "back to normal" scenario that could surreptitiously begin to take hold from the cheerleaders is that I just wouldn't expect to see any leadership coming from the small caps in what is effectively just the beginning of an unavoidable global slowdown. Now that the banks may have been rescued from insolvency they will still have to de-leverage and tidy up their balance sheets.
The behavior of the small caps and mid caps since early September suggests that only recently have fund managers moved from denial of a major economic contraction to realizing that it is going to be worse and more prolonged than previously thought. Technically I would be looking at the 600 level on the Russell 2000 as a good place to lighten long positions from this current bounce, and I would be looking at the short side again when this index comes into the 650 zone.
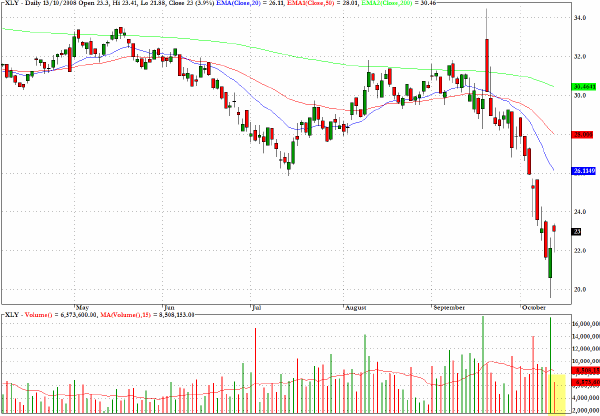
One of the underwhelming charts from yesterday's sharp bounce was for the consumer discretionary sector fund, XLY, which lacked the dynamism and volume of many sectors.
The fund managed a 3.9% gain on only a third of Friday's volume and recorded a hanging man red candlestick.
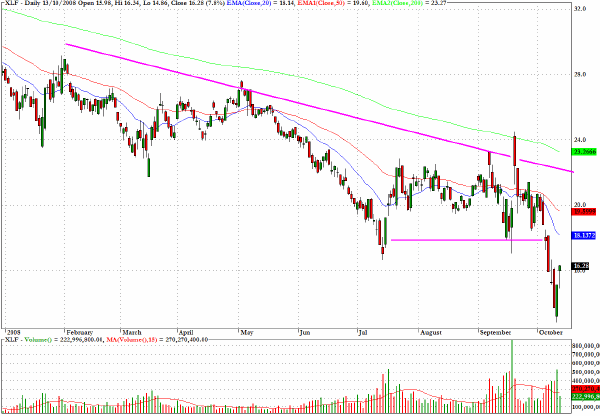
The bounce for the financial sector fund, XLF, was more modest than for many sectors yesterday and the volume was subdued. The $18.20 level should provide a barrier to near term progress upwards.
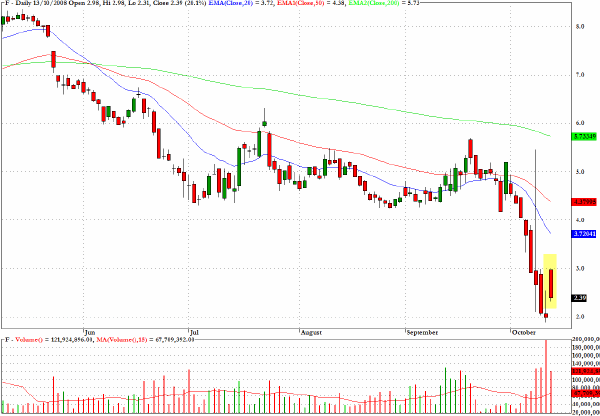
Ford (F) began yesterday's jubilant session on its high for the session and then declined steadily for the rest of the day but still managed to close with a 20% gain. These kinds of technicals make it hard to resist the conclusion that solvency issues are still very much in the minds of fund managers.
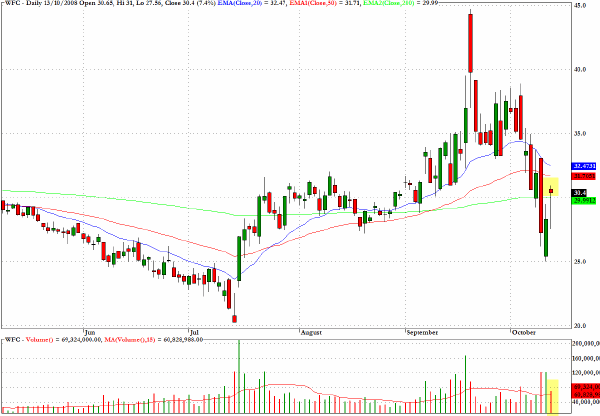
Wells Fargo (WFC) also registered a red hanging man candlestick pattern just above the 200-day EMA but below the 50-day EMA.
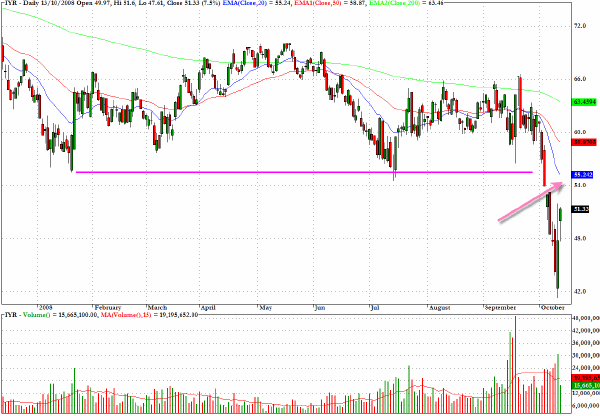
IYR, the sector fund that tracks the Dow Jones US Real Estate index looks vulnerable as it reaches back towards the $55 level.
Clive Corcoran is the publisher of TradeWithForm.com, which provides daily analysis and commentary on the US stock market. He specializes in market neutral investing and and is currently working on a book about the benefits of trading with long/short strategies, which is scheduled for publication later this year.
Disclaimer
The purpose of this article is to offer you the chance to review the trading methodology, risk reduction strategies and portfolio construction techniques described at tradewithform.com. There is no guarantee that the trading strategies advocated will be profitable. Moreover, there is a risk that following these strategies will lead to loss of capital. Past results are no guarantee of future results. Trading stocks and CFD's can yield large rewards, but also has large potential risks. Trading with leverage can be especially risky. You should be fully aware of the risks of trading in the capital markets. You are strongly advised not to trade with capital.
|