| Don't Waste Another Ten Years In The Market |
| By Price Headley |
Published
10/15/2008
|
Currency , Futures , Options , Stocks
|
Unrated
|
|
|
|
Don't Waste Another Ten Years In The Market
The S&P 500 was trading right at 1000 in October of 1998, and it's trading at 1000 here in October of 2008. Buy-and-hold folks - mainly index investors - are basically flat for a decade, or in the hole when you account for inflation. However, to say the market was flat for the last ten years is hardly an accurate description.
In the last ten years, we've also been through two bull markets, and two bear markets. Even within the confines of those multi-year bull and bear markets, we've had smaller trends and counter-trends that were quite sizable in their own right.
More specifically, we've seen lots of nice moves -- both bearish and bullish -- lasting anywhere from a few weeks to a few months. These moves were very trade-worthy, if you knew how to capitalize on them. Just how trade-worthy were they? You might be surprised.
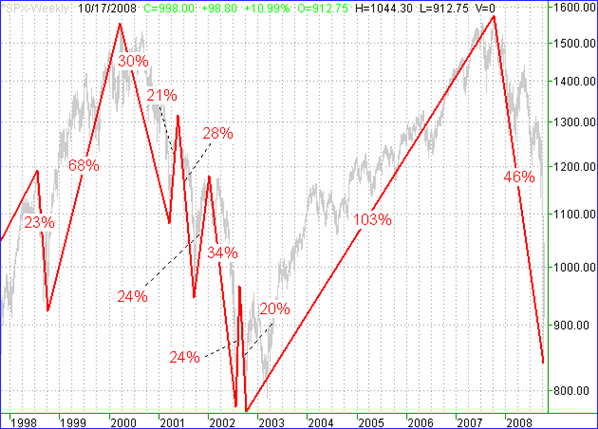
On the weekly chart of the S&P 500 below, I've plotted all the major moves (of 20% or more) with a red line. There were a total of 11 of them -- 6 bearish, and 5 bullish. All told, the combined movement of those 20%+ swings is a stunning 421%. That's right, 421% worth of movement, but a net of 0%.
S&P 500 - weekly, with major trends

Are you still sure buy-and-hold is the right answer for you? Personally, I'd be questioning the idea.
Now, just for your perspective, I run an options portfolio, which is a longer-term options portfolio with managed risk at the forefront. I use weekly charts rather than daily (or shorter timeframe) charts. A lot of people are surprised to hear that from me, but hey, if it works, it works. My system is designed specifically to spot these bigger trends. And over time, it works well. I say that just to alleviate any immediate concern that you'd have to be a highly active trader to reap any of that 421%. The average holding period is measured in weeks and even months. Point being, you don't have to quit your day job to make money in the market.
Now I'm not naive. I know and you know there's no way we can jump in at the exact bottom and get out at the exact top. But, let's just say you get in 5% above all the low points and get out 5% under all the high points. That's still a total movement of 311%. You know what though? Let's go hyper-conservative and say you got bullish 10% above each major low, and got bearish 10% under each major peak. That's still a beautiful 201% worth of net movement. And yes, 10% is a realistic slippage.
There's something else though. We haven't even talked about the leverage of options. The gains or losses on put options or call options is anywhere from 3 times to 10 times the movement of the underlying index or stock.
Let's just be hyper-conservative again though, and let's also be realistic and acknowledge that not every option trade is going to be a winner. Let's just say our effective (average) leverage with all winners and losers is just 2 to 1, which is actually very low. Multiplying our conservative, low-end total movement of 201% by conservative leverage of 2 to 1, we still have the potential to realistically generate 402% worth of gains for a fully invested option portfolio.
Do we actually ever fully invest? No, we tend to only put about half of our capital in at any given time. However, we also have the luxury of hand-picking the best of the best opportunities, so our underlying stocks are apt to move faster and bigger than the rest of the market. The net result of those two opposing realities is effectively canceling each other out, so strong triple digit gains over a 10-year period are still very possible. The point, however, is that there are opportunities for all types of investors to make good money even in what's ultimately a long-term, flat environment.
Price Headley is the founder and chief analyst of BigTrends.com.
|