NASDAQ COMMENTARY
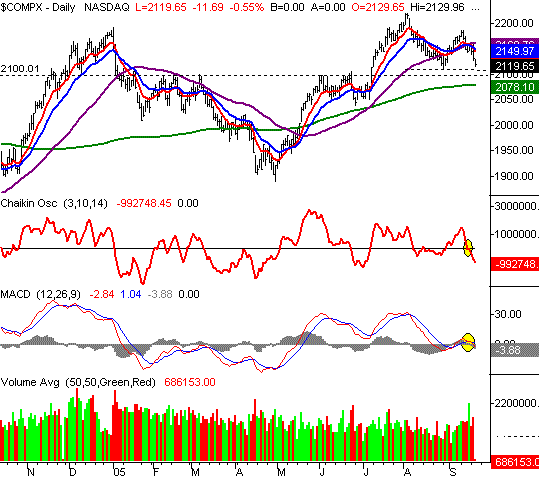
So far, the bears have controlled the week......in a major way. The NASDAQ Composite is 40 points under where it closed last week, so the post-expiration environment hasn't been kind to the bulls at all. In fact, we're in more trouble than most folks may even realize, especially where the NASDAQ is concerned.
First and foremost, the composite is under the 10 and 20 day averages, as of last week. That's a short-term sell signal. The index is also under the 50 day line, which is an intermediate-term sell signal. So it's no surprise to see plenty of other sell signals pop up between then and now......MACD, stochastics, Chaikin line, you name it - they're all in place now. In that light, we have very little choice but to be bearish.
However, there's another subtle chart pattern that the bulls should also be concerned about. On September 12th, the composite peaked just under 2187. The previous significant peak occurred on August 3rd, when the index nearly reached 2220. The point is, we made a lower high. That may seem insignificant, but know this - it's actually the first time we've made a lower high since February. That's right - it's been a volatile year, but the NASDAQ had managed to match or top all of its major peaks after the initial selloff early in the year.
The bearish clincher will be a lower low, which really isn't too far away. The index bottomed at 2112 in late August, so a move under that line would pair a lower low and a lower high together. What you'd get is a bigger picture bearish trend. The NASDAQ is currently at 2122, but had been as low as 2116.15 today. So, that 2112 mark is literally just around the corner. If it holds as support, the bulls will have a reprieve. If it doesn't hold as support, the next potential landing spot is the 200 day line at 2078. By the way, the 200 day line is pointed lower again. That's not exactly a sign of 'full steam ahead' for stocks.
Resistance is at 2150.
NASDAQ CHART - DAILY

S&P 500 COMMENTARY
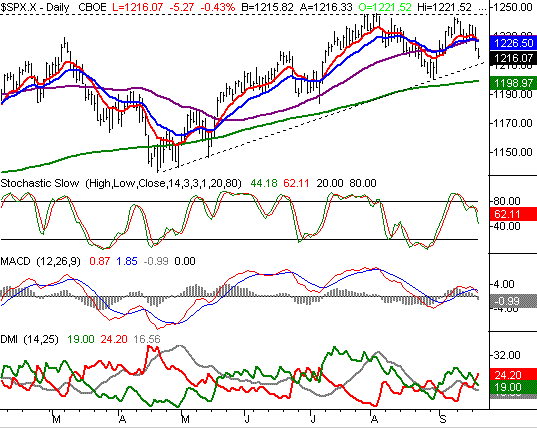
The S&P 500 generated a wave of sell signals too, although this large-cap index doesn't look quite as troubled as the NASDAQ does. That's not to say that it's bullish though, because it isn't. The SPX, from our point of view, is still stuck in a range that is getting increasingly cramped.
Starting from the top, there's clearly some major resistance around 1245. The S&P 500 topped out there twice in the last couple of months, also failing to make a higher high like the NASDAQ. Needless to say, that's our major resistance point from a longer-term perspective. In the meantime, the S&P 500 is also back under the 10, 20, and 50 day averages. It crossed under all of them yesterday, and if we stay right where we are right now (1218), that will confirm those momentum-based sell signals. With all those moving average lines converged at 1227, you can bet we're putting our short-term resistance there.
From the bottom up, the 200 day line could act as support if and when the index got there. However, the S&P is currently 20 points above that long-term average. The more meaningful support area is going to be 1210, where the straight-line support (dashed) currently rests. That's only eight points away, and with the low of 1214.71 earlier in the session, a test of that support level is certainly on the radar.
Like the NASDAQ, it's difficult to deny all the sell patterns we see on the chart. On this chart alone you can see a bearish MACD cross, a bearish DMI cross, and our stochastic sell signal. The sentiment pretty much prevails no matter what technical tools you're using though. So, we have to stay in the bearish camp for now.
On the other hand, we'd be crazy not to acknowledge one important fact.....there has been no sustained follow-through on any move this year. The March/July rally was prolonged, but with a mini-correction right in the middle of it. The March/April selloff was a little lengthy as well, but again, there was a major pause right in the middle of it. This choppiness issue is going to be pressed again, and probably very soon, as the index winds its way down toward 1200 - the low from last month. We can see support and resistance converging. Sooner rather than later, something's got to give. The momentum right now is bearish, but we're skeptical to dig in too deep with that opinion. Long-term support has yet to break, and we're approaching the most bullish time of the year. Be cautious no matter what side of the market you're on.
S&P 500 CHART - DAILY

DOW JONES INDUSTRIAL AVERAGE COMMENTARY
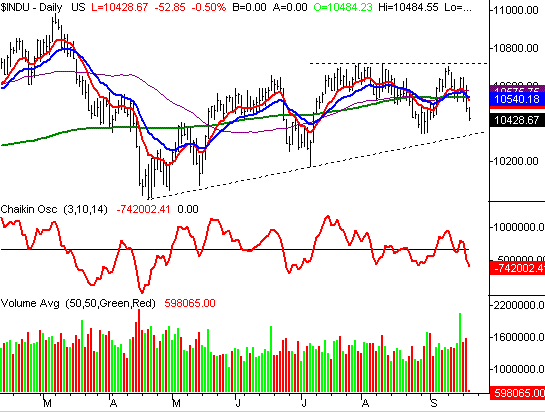
Once again, there's nothing new to discuss here, so we'll make it short and sweet. The Dow also fell under all of its key short-term averages in the last couple of days. But, there's one stark difference with the Dow - it's back under its 200 day moving average line. So in all timeframes, the Dow's momentum is bearish. On the other hand, the Dow has crossed all of these averages a grand total of seven times in the last since months (four under, and three over). Therefore, it should come as no surprise to hear that the Dow is right where it was in early April. And for the year, the blue-chip index has been effectively trapped between 10,000 and 10,720 - a testament to how much traction (good or bad) the index hasn't been able to get.
So like the S&P, we're skeptical of all the bearish patterns we're seeing here. It's not that the Dow can't go lower - it just hasn't done so (in any meaningful way) for months. And with that major support just below the index at 10,340, we have to be patient enough to wait and see if it holds. It should be a short wait though - the Dow Jones Industrial Average is currently at 10,430.
Long-term resistance is still at 10,720, while short-term resistance is now at 10,550.
DOW JONES INDUSTRIAL AVERAGE CHART - DAILY

Price Headley is the founder and chief analyst of BigTrends.com.a