| Corcoran Technical Trading Patterns For October 17 |
| By Clive Corcoran |
Published
10/17/2008
|
Stocks
|
Unrated
|
|
|
|
Corcoran Technical Trading Patterns For October 17
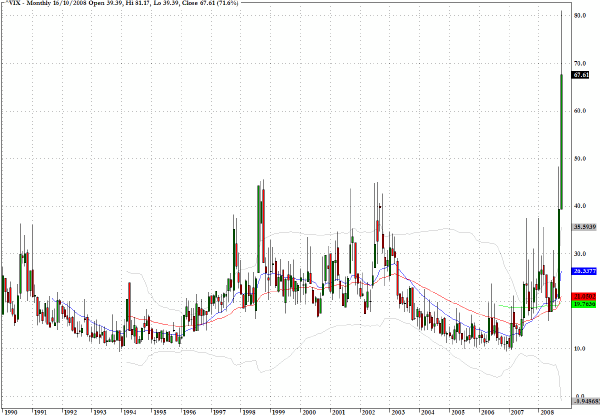
Volatility surged in yesterday's session, with the VIX surpassing the 80 level. The long-term chart below more or less covers the entire data history for this index and highlights that we are enduring market conditions that are of a different order of magnitude to anything seen in 20 years.
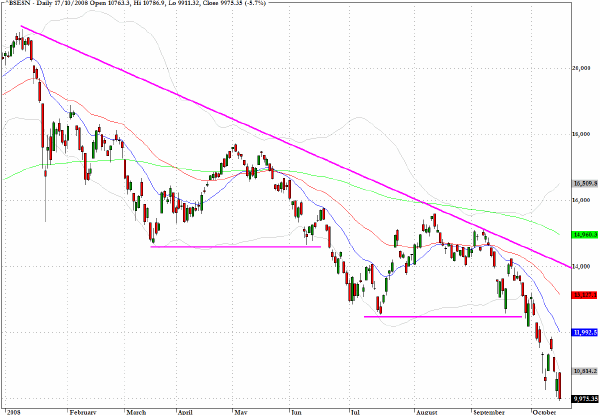
The markets are behaving so erratically at present that I am going to remain as a fascinated bystander. What is most striking as of Friday morning's action is that global indices are not only exhibiting tremendous intraday volatility but also starting to move out of sync with each other. Within European trading the FTSE, DAX and CAC40 have not only been all over the map this morning but are out of their customarily approximate alignment, and in Asian trading the Nikkei managed a small gain whereas many of the South East Asian markets continued downwards. As seen below the Mumbai Exchange dropped almost six percent to a new 2008 low.
This kind of thrashing around suggests that the bottom fishers are being severely tested and that a real struggle for overall control by the bulls and bears for direction still has some way to go.

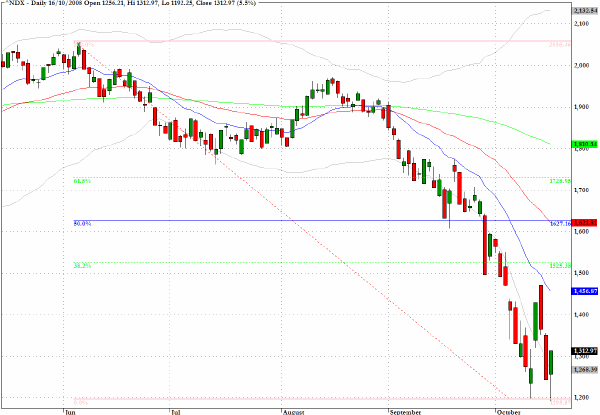
The Nasdaq 100 (^NDX) pierced the 1200 level briefly in yesterday's session, establishing a new multi-year intraday low but then rallied strongly into the close.
I will be watching this index most closely over the next few sessions for any evidence that stabilization could get the upper hand, at least temporarily, over the continuing and painful de-leveraging process that is under way.

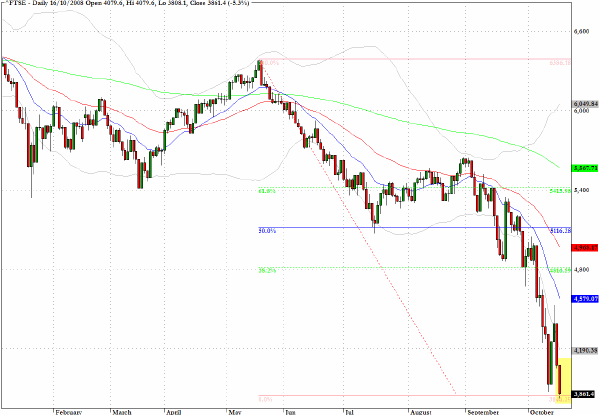
The FTSE failed to hold above last Friday's low in yesterday's five percent plus sell-off.

One of the global indices that is worth monitoring for a sense of speculative sentiment is the Mumbai Sensex (^BSESN) and in Friday's session the index broke below the psychologically important 10,000 level to register its lowest close since July 2006. This index joins several other global indices in having dropped more than fifty percent during the last year.

Clive Corcoran is the publisher of TradeWithForm.com, which provides daily analysis and commentary on the US stock market. He specializes in market neutral investing and and is currently working on a book about the benefits of trading with long/short strategies, which is scheduled for publication later this year.
Disclaimer
The purpose of this article is to offer you the chance to review the trading methodology, risk reduction strategies and portfolio construction techniques described at tradewithform.com. There is no guarantee that the trading strategies advocated will be profitable. Moreover, there is a risk that following these strategies will lead to loss of capital. Past results are no guarantee of future results. Trading stocks and CFD's can yield large rewards, but also has large potential risks. Trading with leverage can be especially risky. You should be fully aware of the risks of trading in the capital markets. You are strongly advised not to trade with capital.
|