| Corcoran Technical Trading Patterns For October 20 |
| By Clive Corcoran |
Published
10/20/2008
|
Stocks
|
Unrated
|
|
|
|
Corcoran Technical Trading Patterns For October 20
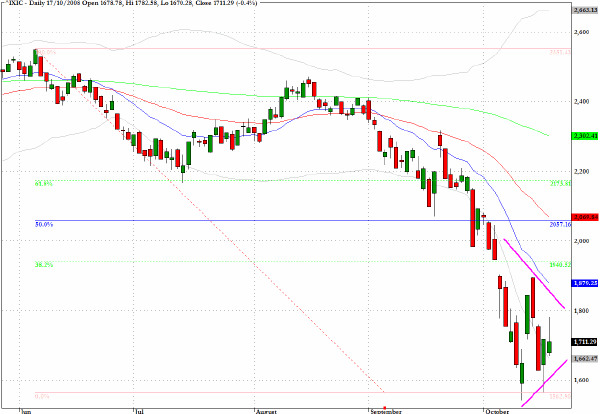
Triangular formations are developing on many charts for both indices and individual stocks. These suggest that while the markets are exhibiting a tremendous amount of intraday volatility the inter-day patterns are showing that the market is drifting sideways as it postpones the directional resolution that is now required. We could continue moving further into the apex of these triangles for a while but one senses that the market is waiting for more clarity on whether the financial lifeboats that have been thrown in abundance are going to unclog the inter-bank market effectively.
Many financial bloggers are getting very worked up about the possibility of a real Armageddon when the CDS market tries to unwind and settle a lot of the detritus from the Lehman and AIG collapses. At this stage we shall register our own concerns for another major downward surprise, but while there are no major seismic disturbances there may be a tendency for fund managers to get stressed about the fact that they could get left behind if a Buffet inspired band wagon gets started.
The chart for the Nasdaq Composite (^IXIC) emphasizes how much risk there could be on the short side of the market right now. The triangular formation could lead to an upward breakaway but then traders would still have a 300-point no man's land (up to 2050) with few clues as to how sustainable any rally might be. For those favoring the short side, this lack of real technical guidance poses an unfavorable risk/reward ratio.

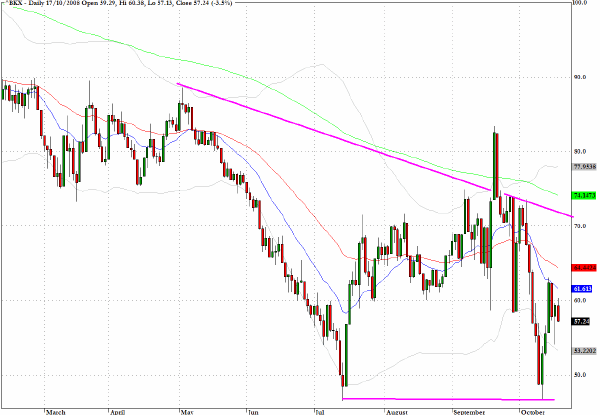
The KBW Banking Index (^BKX) shows a possible double bottom process with an ensuing triangular formation. The presumption would be that this will resolve to the upside but as previously intimated one cannot rule out the chance that there will be nasty surprises ahead from the derivatives markets.

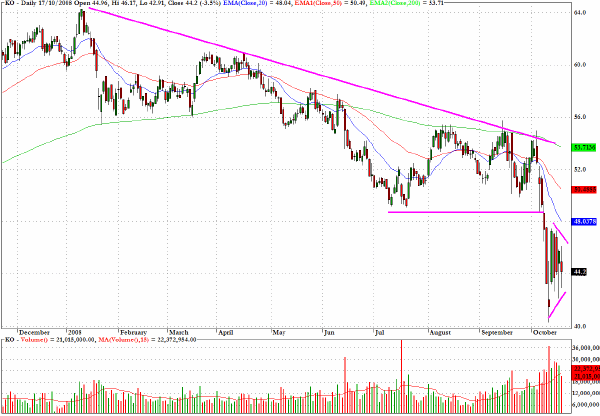
Coca Cola (KO) reveals a typically bearish pattern that characterizes the action in 2008 so far and, with clear evidence of a triangular formation evolving, I would suggest patience until this pattern is resolved.

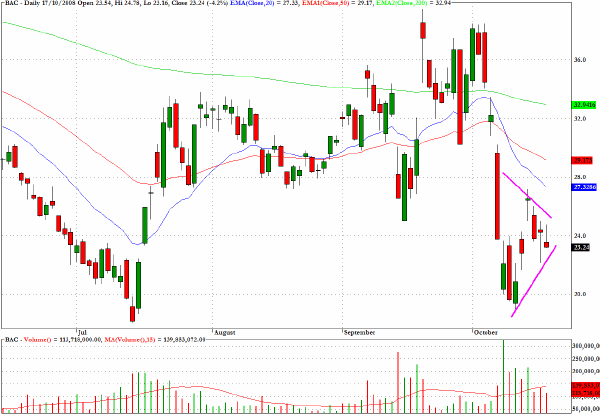
Of the major banks, the chart for Bank of America (BAC) encapsulates the recent indecision about whether a double bottom pattern can be confirmed. Friday's inside day formation suggests that a breakaway session is imminent.

Clive Corcoran is the publisher of TradeWithForm.com, which provides daily analysis and commentary on the US stock market. He specializes in market neutral investing and and is currently working on a book about the benefits of trading with long/short strategies, which is scheduled for publication later this year.
Disclaimer
The purpose of this article is to offer you the chance to review the trading methodology, risk reduction strategies and portfolio construction techniques described at tradewithform.com. There is no guarantee that the trading strategies advocated will be profitable. Moreover, there is a risk that following these strategies will lead to loss of capital. Past results are no guarantee of future results. Trading stocks and CFD's can yield large rewards, but also has large potential risks. Trading with leverage can be especially risky. You should be fully aware of the risks of trading in the capital markets. You are strongly advised not to trade with capital.
|