| Corcoran Technical Trading Patterns For October 21 |
| By Clive Corcoran |
Published
10/20/2008
|
Stocks
|
Unrated
|
|
|
|
Corcoran Technical Trading Patterns For October 21
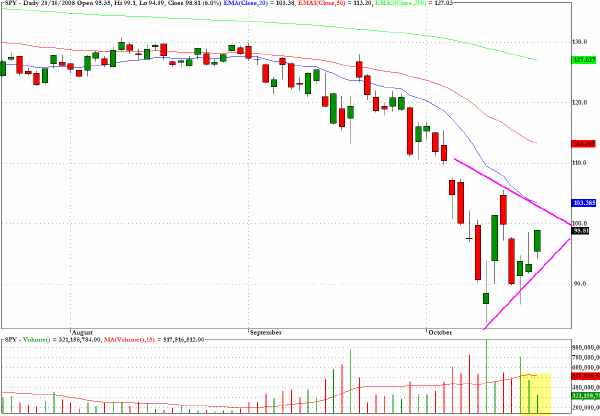
The S&P 500 (SPX), along with many other indices, produced a trend day yesterday but on much reduced volume as reflected in the exchange traded fund SPY. The triangular formation is being extended, and until the directional breakout really presents itself, I would remain wary of being swayed by either those pushing the credit market recovery story or the derivatives meltdown story.

The KBW Banking Index (^BKX) barely budged in yesterday's trading, and the volume on the exchange traded fund XLF, which represents a wider cross section of financial services, was very noticeably subdued. Clearly this sector is in a holding pattern until some of the opacity regarding the rescue package, unwinding of derivatives, etc. becomes clearer.

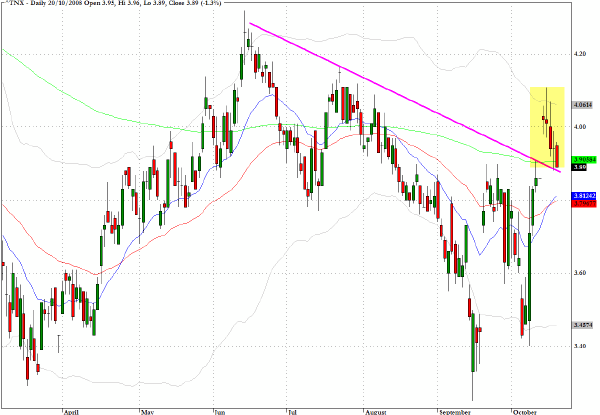
The yield on the ten-year Treasury has now retreated to a level which, if transgressed, would question the notion that the recent break above 4% reflected a serious shift in sentiment regarding the attractiveness of US government debt.

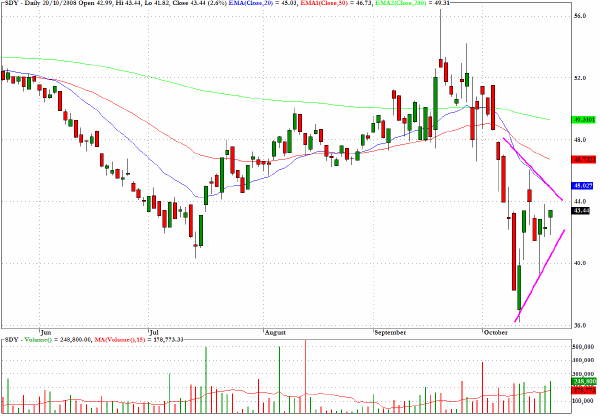
SDY, which is a sector fund that tracks the S&P High Yield Dividend Aristocrats index, has, in common with so many funds, a very well formed triangular pattern, and in this instance I would suggest that an upside breakout could be imminent.

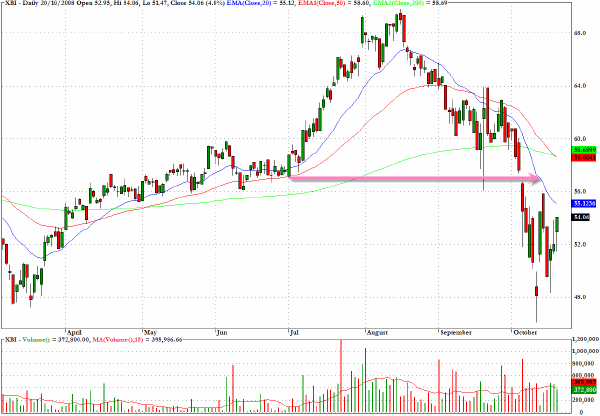
XBI, which is a sector fund that tracks the S&P Biotechnology Select Industry index, would seem to face chart resistance at both the $57 level and an even stiffer hurdle above that around $58.50 where two long-term moving averages have crossed.

Clive Corcoran is the publisher of TradeWithForm.com, which provides daily analysis and commentary on the US stock market. He specializes in market neutral investing and and is currently working on a book about the benefits of trading with long/short strategies, which is scheduled for publication later this year.
Disclaimer
The purpose of this article is to offer you the chance to review the trading methodology, risk reduction strategies and portfolio construction techniques described at tradewithform.com. There is no guarantee that the trading strategies advocated will be profitable. Moreover, there is a risk that following these strategies will lead to loss of capital. Past results are no guarantee of future results. Trading stocks and CFD's can yield large rewards, but also has large potential risks. Trading with leverage can be especially risky. You should be fully aware of the risks of trading in the capital markets. You are strongly advised not to trade with capital.
|