| The McMillan Options Strategist Weekly |
| By Lawrence G. McMillan |
Published
10/24/2008
|
Options
|
Unrated
|
|
|
|
The McMillan Options Strategist Weekly
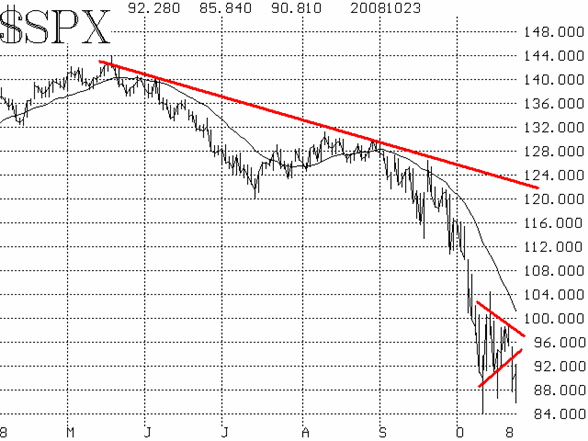
The chart of $SPX remains negative (Figure 1). The trend lines are pointing downward, and the 20-day moving average is trending down -- currently at about 1010. None of the brief oversold rallies to date has even been able to reach the declining 20-day moving average, a fact which underscores the extreme bearishness of this market. The $SPX chart won't turn bullish until a pattern of higher highs and higher lows emerges. After the deep decline on October 10, it appeared that the chart was working toward that bullish pattern, but yesterday's decline to new closing lows disbanded that notion. So, there is now tentative support in the 840-860 area on $SPX (the intraday lows of the last couple of weeks).

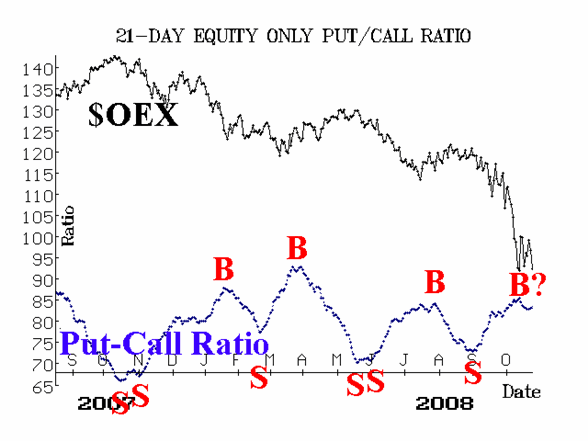
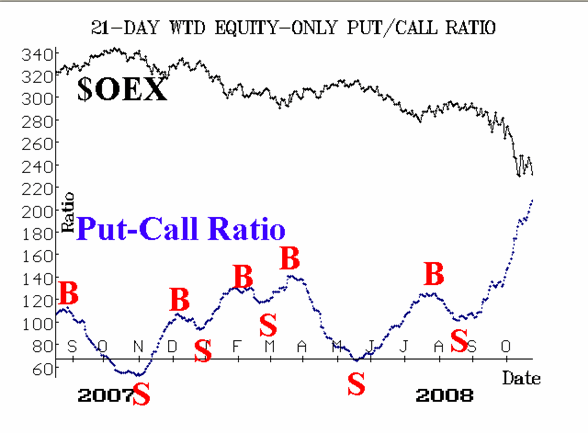
The equity-only put-call ratios are bearish. Certainly the weighted ratio is bearish (Figure 3) as it is rising to heights last seen after the terrorist attacks in 2001. The standard ratio appeared to roll over to a buy signal, but the rollover was at least partially due to heavy call volume, as traders have begun to sell (out-of-the-money) calls because they are so expensive. That ratio is now in doubt once again, as it has begun to rise in the past two days.

Market breadth has been abysmal. An analyst on TV today indicated that breadth has been underperforming the market for over a year, and we agree wholeheartedly. However, breadth won't give a true buy signal until it begins to improve with some consistency. That is going to require several days of advances outnumbering declines -- probably something on the order of three out of four days.

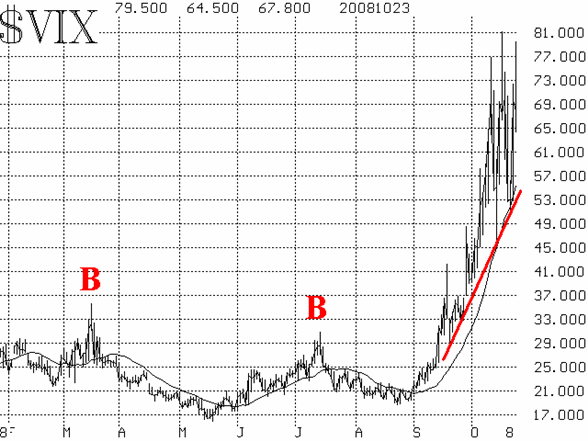
Volatility indices ($VIX and $VXO) continue to hover near all- time highs. Spike peaks in $VIX have resulted in very short-term rallies. There was one today, as $VIX traded up to nearly 80, but closed below 68. That accompanied a 60-point rally in $SPX. There may not be any continuation, though -- a far cry from the way things used to work. We don't expect $VIX to give a true buy signal until it breaks the uptrend that it's in. $VIX would have to close below 51 to do that.

In summary, we have no intermediate-term buy signals (perhaps the standard equity-only ratio, but not really). Thus we must remain bearish. The oversold nature of the market might generate sharp rallies. While they might be strong, we don't expect them to last unless they can generate true buy signals.
Lawrence G. McMillan is the author of two best selling books on options, including Options as a Strategic Investment, recognized as essential resources for any serious option trader's library.
|