In our last episode, we demonstrated how five down closes in a row followed by an up close suggests a higher open-to-close the next day. (And vice versa following the same series of higher closes.) This is a nifty little bias that conforms to expectation. Five closes in the same direction is pretty extreme, after all, and once the pattern is first broken, it’s reasonable to assume that there will be at least brief follow-through.
A broader question we might ask is: once such an extreme formation of closes ends, does it signify a longer-term end of the move -- a more significant bottom or top? (The five-day aberration proves to be the overdone climax, in other words.) Or, are we going to find that the opposite is true — a uni-directional five-close anomaly is the insistent move, and the end of it is just a temporary letup?
It turns out our new direction is the counter-move, and we can’t exploit it any further than the single day we’ve outlined. The fact is, the reversal is a bias within a bigger bias that says, "heed those five down closes — this market remains weak."
Through a cursory eyeballing of charts and some optimization, it becomes clear that you could actually make money on the previous method by taking the opposite position. It’s just a matter of holding on longer — not exiting on the first day. That suggests we’d want to skip that initial first day entry entirely, and take an opposite position the next day. By entering longs two days after a lower close that immediately followed five higher closes in a row — (what happens yesterday is irrelevant) — you can produce a bigger bias than what we obtained in our last posting. You can get it bigger still by reducing the unbroken string of up/down moves to four.
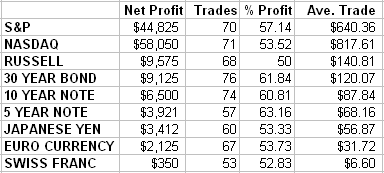
Here are the results of tracking four up closes in a row followed by a down close, skipping the next day and buying on the following open. Exit on the close. Vice versa for shorts. This represents five years of data.

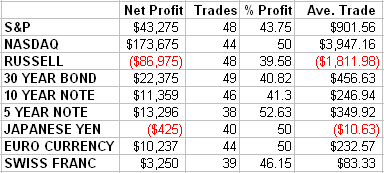
It’s always nice to be able to make money intra-day with no threat of overnight risk. With the consistent net profits, high percentage of returns and huge average per trade figures (easily enough to qualify for actual systems in some of the markets), the one-day methodology seems pretty formidable. Again though, testing reveals even more in the way of general market direction. You can do well holding onto these trades in a variety of time frames. Below, Figure 2 shows how you’d do exiting after 25 days, roughly a month’s worth of sessions.

Art Collins is the author of Market Beaters, a collection of interviews with renowned mechanical traders. He is currently working on a second volume. E-mail Art at artcollins@ameritech.net.