| Outlook On The Stock Indices |
| By Price Headley |
Published
10/26/2008
|
Stocks
|
Unrated
|
|
|
|
Outlook On The Stock Indices
NASDAQ Composite
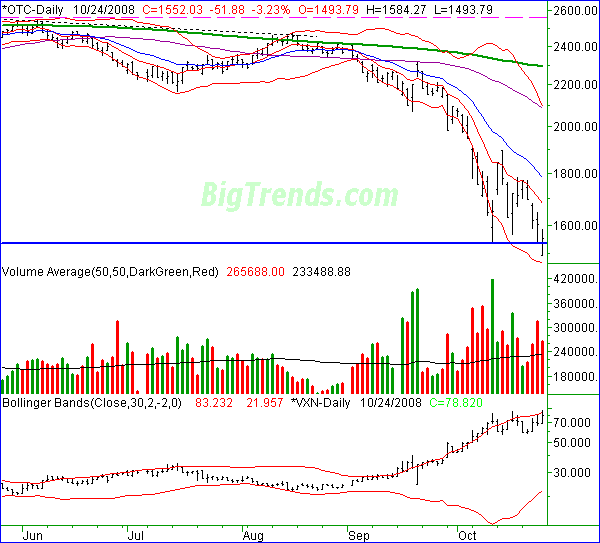
The NASDAQ Composite was off by 3.23% (-51.88 points) on Friday, leading to a close of 1552.03. That was 9.31% below (-159.26 points) the prior week's close. More than that, the composite hit a new multi-year low on Friday, not to mention it closed at a multi-year low closing level. Nothing new about that.
There's really not a lot of analysis to be done here - the market's getting slaughtered, and nobody's going to get in the way. The only thing we can offer regarding the NASDAQ is the same perspective we've been offering. The VXN tells us we're ripe for a rebound, and the index is wildly oversold. It's now more than 31% below its 200-day moving average line (green), which is one of the widest disparities ever on record. It 'should' lead to a rebound, but clearly it hasn't yet.
There's one thing new we can add today though. Look at the 10-day moving average line (red). We've not seen the composite close above it since September 19, and that was the only time it's happened since August. In fact, the index has barely been able to trade above it on an intra-day basis. So, that may well be the indication of a bullish turning point.
Until then, however, the NASDAQ's brush with new lows is hardly a bullish omen. The other two charts give us a little better framework to think about.
NASDAQ Composite Chart - Daily

S&P 500
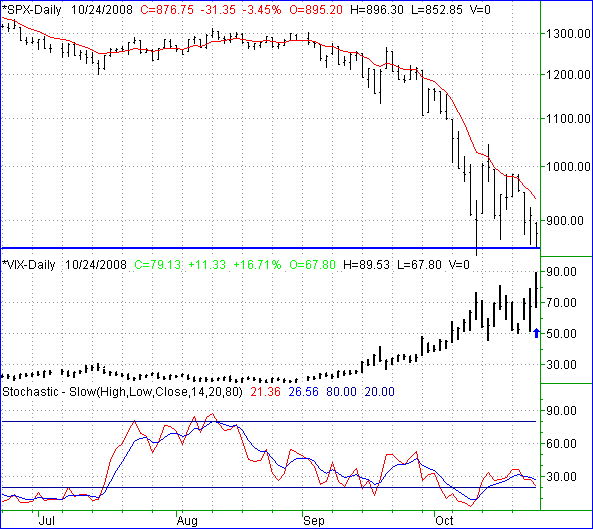
The close of 876.75 on Friday was the result of the S&P 500's 3.45% dip (-31.35 points). For the week, the large cap index was lower by 6.78% (-63.8 points). Despite the loss though, we may have seen an important support line come into focus. Friday's low of 852 may be the market's line in the sand. Or, it may be the low of 840 from a couple of weeks ago; it's not perfectly clear yet. However, there's some key support being made in the area.
At the same time, the S&P 500's 10-day moving average line is giving us a clue as well. The large cap index has managed to make a few closed above the 10 day average, though none of them stuck, and they were all of the 'barely' variety. So, we'll use that as a bullish benchmark for this chart too. The net result is essentially a wedge -- horizontal support and declining resistance are squeezing the chart, and one side's got to break soon.
With the SPX heading back into oversold territory, and with the VIX peaking just under 90 on Friday, one would think a rebound is the only possibility. However, a rebound was pretty much the only possibility two weeks ago, yet the market continued to deteriorate. Don't think too much about what the market 'should' be doing; focus on what it is doing. Right now it's not doing much of anything, but that contracting wedge shape could set up some movement, one way or another, very soon.
S&P 500 Chart - Daily

Dow Jones Industrial Average
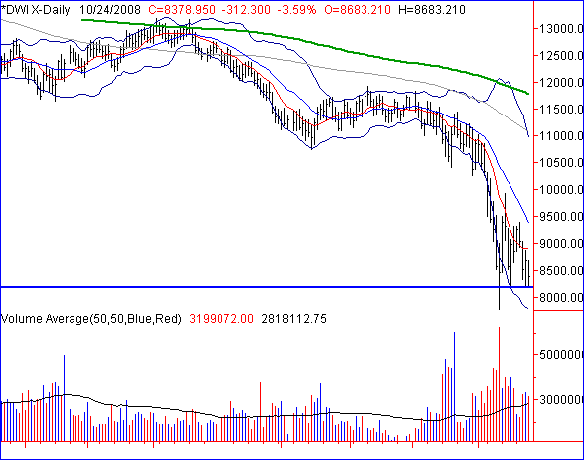
The Dow sank 3.59% (-312.3 points) on Friday to end the week at 8378.95. On a weekly basis, the blue chip stock index was down 5.35% (-473.27 points). As we saw with the S&P 500 though, a support line stepped up and prevented the Dow from stepping into new low territory.
That support line is roughly at 8180. The Dow traded under it on October 10, but also staged a huge rally that same day. Watch that level. It may warn us of worse things to come.
We also want to look at the Dow's 10-day average line (red), not so much as a potential recovery signal, but because it's flattened out over the last 10 days. That means nothing yet, but it's a sign that the overall trend could finally be changing, at least for the blue chips. The implication is just that a cross above the 10-day average, or a cross of the 10-day line over the 20-day line, is fairly close.
By the way, the Dow is now 29% under its 200-day line (green). The biggest difference ever that we're aware of.
Dow Jones Industrial Average Chart - Daily

Price Headley is the founder and chief analyst of BigTrends.com.
|