| Corcoran Technical Trading Patterns For October 27 |
| By Clive Corcoran |
Published
10/27/2008
|
Stocks
|
Unrated
|
|
|
|
Corcoran Technical Trading Patterns For October 27
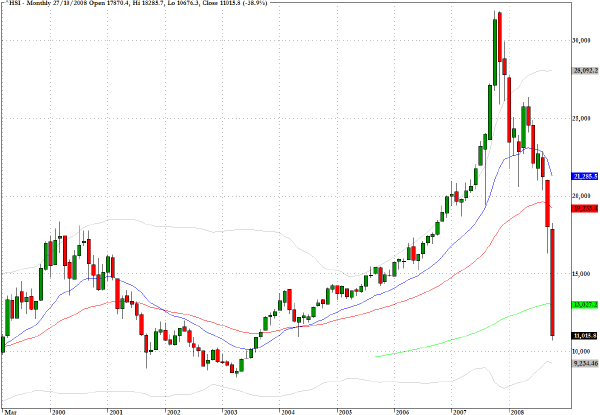
The Nikkei 225 continued its fall with another six percent drop in Asian trading on Monday which took it down to levels not seen since 1982. In some ways even more remarkable was the action in the Hang Seng which dropped by a rather breathtaking 12.7% and has now fallen almost forty percent just during the month of October.
When will this end? Will the markets have to be closed for some time to take a breather from the forced liquidation, as some, including Nouriel Roubini, are now suggesting?
My own view is that we have hardly any precedents to guide us on where we are at present. Way too much complexity in the financial intermediation processes that we have created makes it virtually impossible to get the current crisis in a true perspective.
Value players continue to point to great bargains and of course there are still appealing fundamental values in the assets and human enterprise that lies ahead – it is just that a lot of our current "wealth" has been and will continue to be hypothecated in instruments that are still being unwound
How long will it take to recover? In my estimation a lot will depend on how deep are the anger and the feelings of distrust that ordinary folks have for the institutional framework that provided no checks and balances on the excesses.
Boom and bust will always be part of economic life and it has been hubristic and dishonest to pretend otherwise.
This could be the first collapse in which even the “Smart” money has got it wrong – but let’s hope that we will all be smarter when the de-leveraging is over and done with.
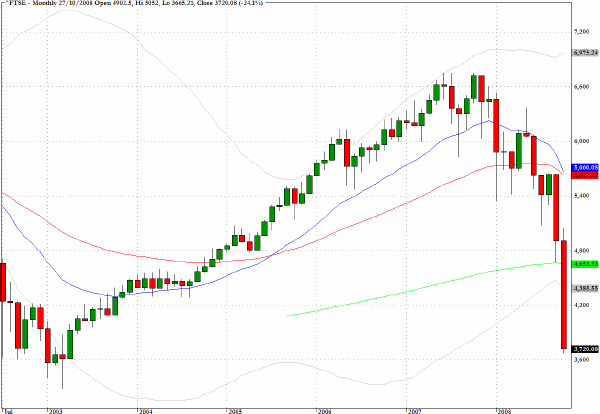
Sterling continues to get buffeted in the FX markets and the UK economy has clearly gone into a tailspin. The target to keep in mind is the close on the FTSE of 3287 which was achieved on March 12, 2003
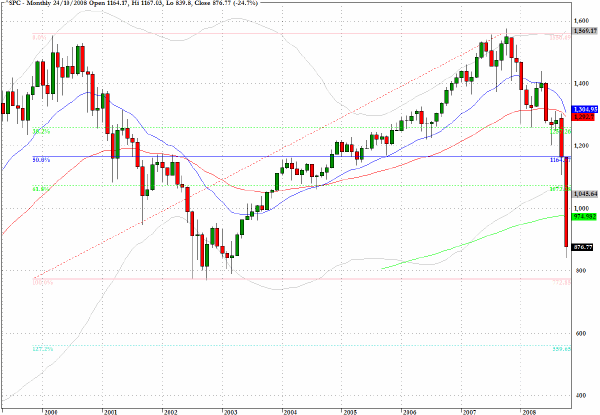
The S&P 500 is returning to its quiet crash mode where there are some signs of bottom fishing, which is arresting the decline but where the de-leveraging just grinds on.
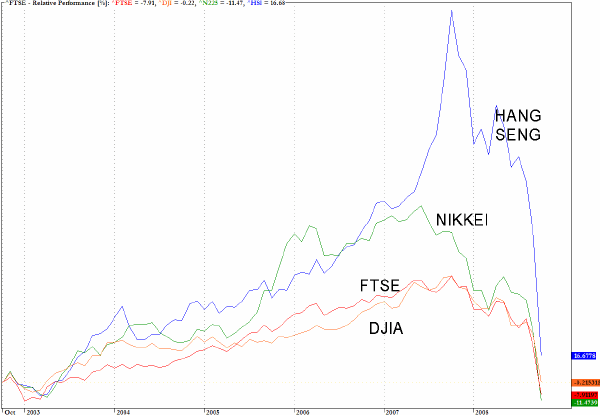
Sometimes a visual or graphic shows more clearly than any amount of textual analysis the market's predicament. The chart below shows the relative performance of four major global indices with a base period set in October 2002. Two things are apparent. One is that the convergence back towards the base value has been accelerating and the second is the dramatic fall in the Hang Seng index during the last several months. So much for de-coupling.
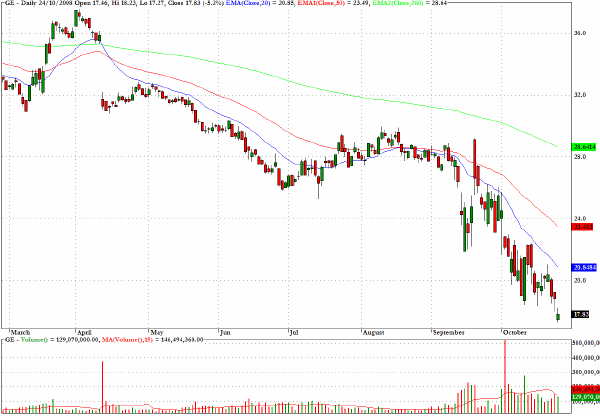
General Electric (GE) has one of the more troubling charts among the major Dow components. The stock has been cut by more than half in six months, the downward trajectory is unrelenting and it would be hard to point to any technical clues which suggest that any kind of basing pattern is evident.
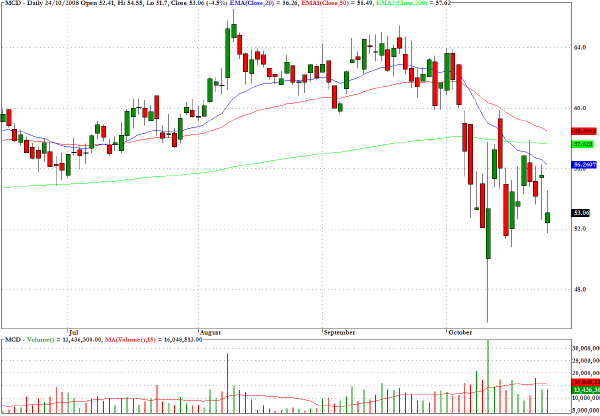
MacDonald's (MCD) has seen far less liquidation than GE but the broadening pattern on relatively light volume since the October 10 low, which attracted some clear buying interest, shows that there has been no real evidence of ongoing accumulation since.
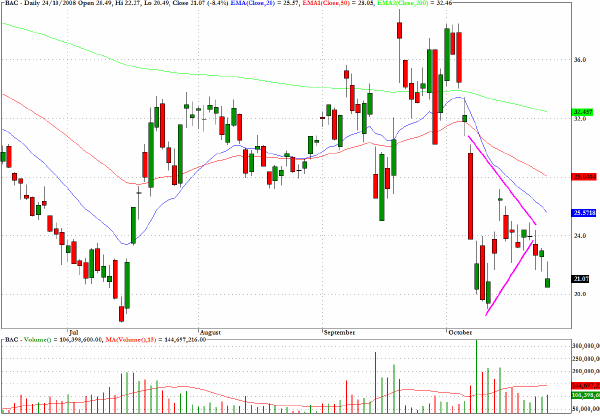
The chart for Bank of America (BAC) also illustrates that since the October 10 low, which brought in some buyers, the price drift into the triangular pattern is now in jeopardy and a retest of the mid-July low now seems a virtual certainty.
Clive Corcoran is the publisher of TradeWithForm.com, which provides daily analysis and commentary on the US stock market. He specializes in market neutral investing and and is currently working on a book about the benefits of trading with long/short strategies, which is scheduled for publication later this year.
Disclaimer
The purpose of this article is to offer you the chance to review the trading methodology, risk reduction strategies and portfolio construction techniques described at tradewithform.com. There is no guarantee that the trading strategies advocated will be profitable. Moreover, there is a risk that following these strategies will lead to loss of capital. Past results are no guarantee of future results. Trading stocks and CFD's can yield large rewards, but also has large potential risks. Trading with leverage can be especially risky. You should be fully aware of the risks of trading in the capital markets. You are strongly advised not to trade with capital.
|