| A Mid-Week Look At The Major Indices |
| By Price Headley |
Published
10/30/2008
|
Stocks
|
Unrated
|
|
|
|
A Mid-Week Look At The Major Indices
S&P 500 Index
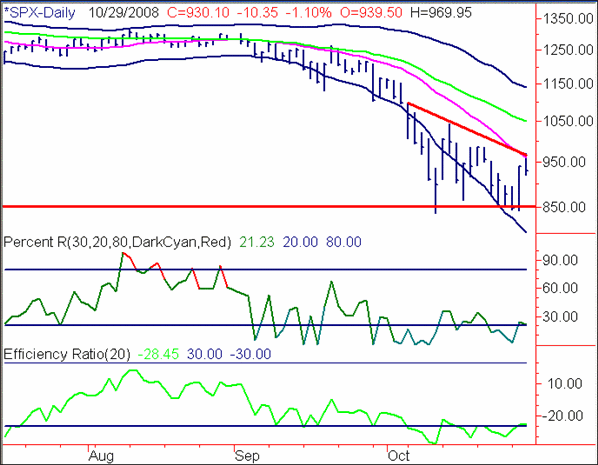
It looks like we have formed a short-term downtrending line on the S&P 500 Index Daily Chart based on the October 6 high. We had a third recent test of this line yesterday (red line on the chart below). This trendline is at about 970 currently. I would like to see a close above this line to confirm an upside breakout. If we fail to break this level, I would see a re-test of the 850ish level as a good possibility. There is also a horizontal trendline developing around that 850 level, forming somewhat of a sideways "wedge" formation That is a technical formation that generally forms a narrow range until an explosive breakout/breakdown occurs.
S&P 500 Index Daily Chart

NASDAQ 100 Index
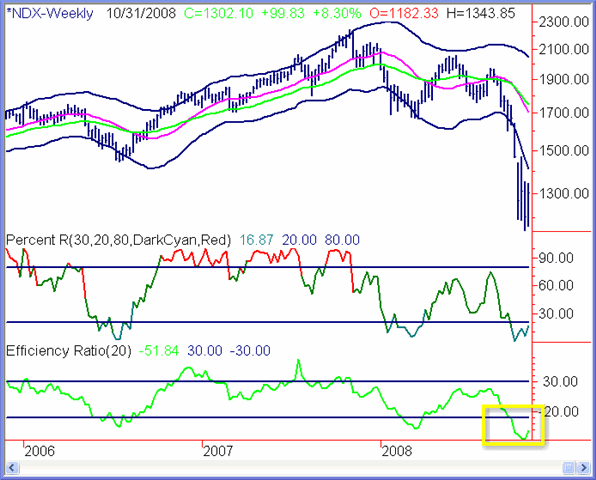
Stepping back to look at a 3-year weekly NASDAQ 100 Index Chart, you can see just how far we have broken below the Weekly Bottom Acceleration Band. A rally back to 1500 on this Index (currently around 1314) certainly seems possible over the medium-term, but the extremely low Efficiency Ratio reading (yellow box at the bottom) is quite a concern.
NASDAQ 100 Index Weekly Chart

Dow Jones Industrial Average
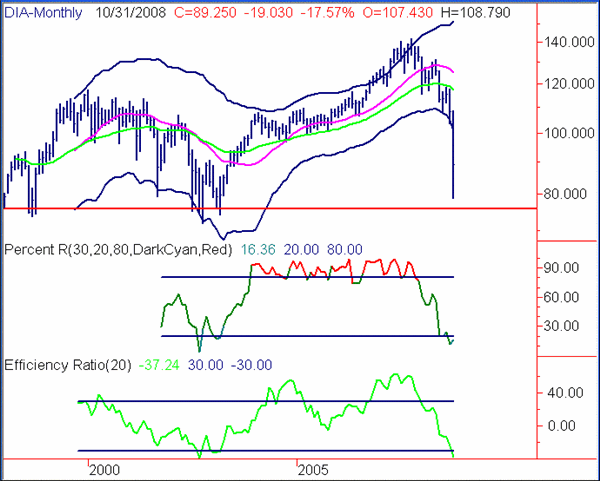
Stepping back even further to look at the 10-year chart of the DIA (DJIA ETF), you can clearly see the amazingly big range that has occurred in October. The underlying DJIA has had a range of around 7,800 to 10,800 this month! 7,500 (75 on the DIA) is a key support level, going back to 1998 and 2002/2003.
Dow Jones Industrial Average (DIA) Monthly Chart

The bottom line from looking at the different time frames on these major indices to me is that the short-term daily chart looks likely to head lower, while the longer-term weekly chart looks to have some limited upside potential, and the even longer-term monthly chart looks like it will eventually test the previous lows, then have some serious base building to do.
Price Headley is the founder and chief analyst of BigTrends.com.
|