| The McMillan Options Strategist Weekly |
| By Lawrence G. McMillan |
Published
10/31/2008
|
Options
|
Unrated
|
|
|
|
The McMillan Options Strategist Weekly
The October Seasonal bullish period has jump started a market rally that has at least lasted a few days. This seasonal bullishness expires this week, though, and then the market will be on its own again. Intermediate-term buy signals are in the process of being formed, but full confirmation is not yet in place.
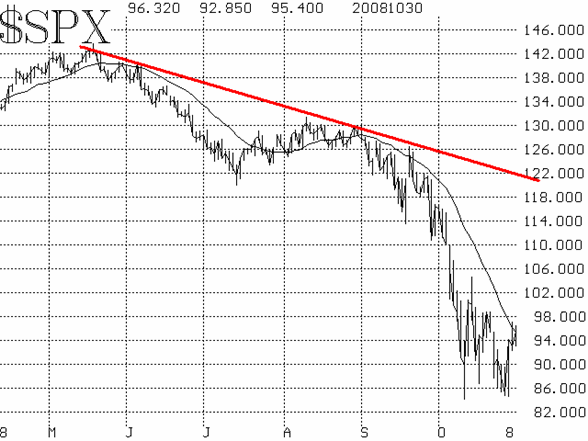
We hit a virtual home run with our October Seasonal buy at the close of trading last Monday. That was the closing low for $SPX to date, near 850. A monster rally pushed $SPX quickly higher over the next two days, where it eventually ran into resistance at the declining 20-day moving average, near 970. This sort of action -- while a welcome relief to the bulls -- constitutes nothing more than an oversold rally in a bear market. Usually, these rallies carry slightly past the moving average, but have no real staying power. Rather, what is necessary for an intermediate-term buy signal on the $SPX chart is a pattern of higher highs and higher lows.

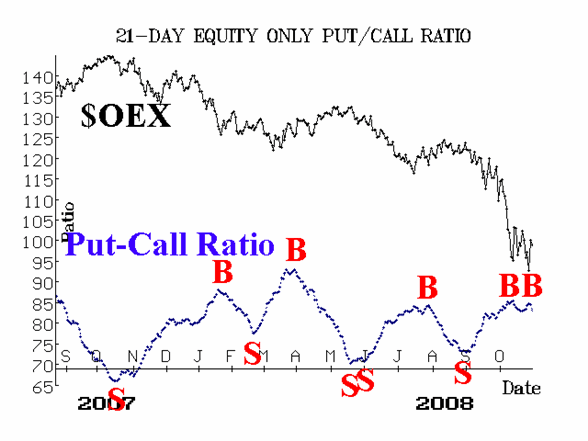
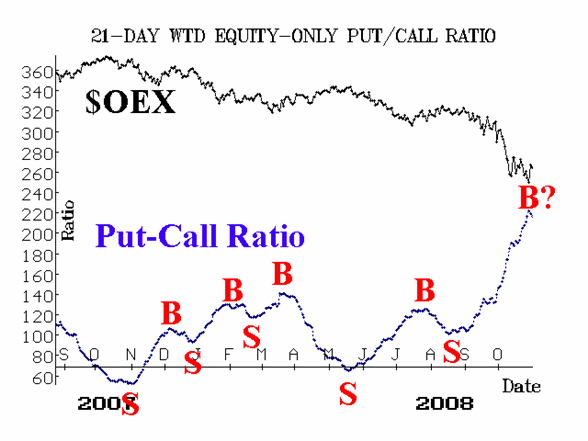
The equity-only put-call ratios are turning bullish. They are the first indicators to do so on an intermediate-term basis. The standard ratio (Figure 2) has actually formed a double buy signal, with the first one having been a bit premature. The weighted ratio (Figure 3), meanwhile, had blasted to new highs last seen in 2001. In the last couple of days, it has edged downward, and our computer analysis has called it a confirmed buy signal. Obviously, if either ratio should reverse and make new highs, that would negate these buy signals and return the indicators to a bearish status (much as happened with what appeared to be buy signals in late September).

Market breadth continues to improve this week, as there have been three straight days in which advances have led declines -- one of which was a "90% up day."

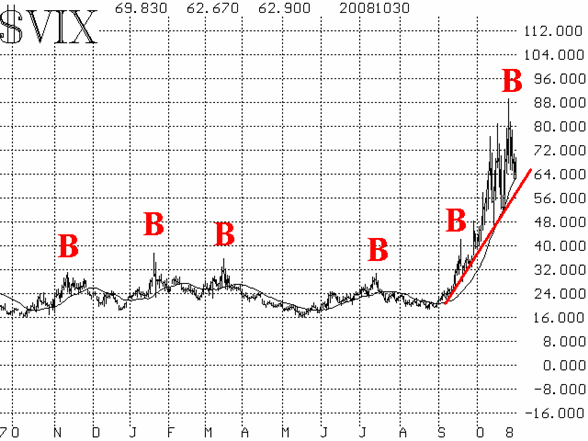
The volatility indices ($VIX and $VXO) made spike peaks with Tuesday's strong rally. However, in this market, volatility spike peaks are nothing more than short-term buy signals. The more lasting, intermediate-term buy signal will occur when the trend of rising volatility is broken. At the current time, that would mean $VIX has to close below about 53 in order to violate the trend line in Figure 4.

In summary, the massive oversold condition is being worked off, and that has generated the current short-term rally. Intermediate-term buy signals are beginning to appear as well (equity-only put-call ratios and NYSE breadth). The most bullish scenario would be for the other indicators to turn bullish, and if there is then a move by $SPX above the highs of the current rally, then an intermediate-term buy signal will be at hand. However, any relapse prior to that, accompanied by a move to new lows, would negate the whole process and require that the base-building begin anew.
Lawrence G. McMillan is the author of two best selling books on options, including Options as a Strategic Investment, recognized as essential resources for any serious option trader's library.
|